Valuing Vessels
Fig. 9.1
Secondhand Prices and number of transactions for Tankers between January 2007 and December 2009. Source: Clarkson Research Services
In addition, loans granted by banks decreased substantially because of the financial crisis (see Fig. 9.2). Nowadays, to obtain a bank loan, additional collateral apart from the underlying vessel to be financed must often be provided. As vessels are financed largely than other assets with debt, particularly the shipping industry has suffered from the limited availability of bank loans.
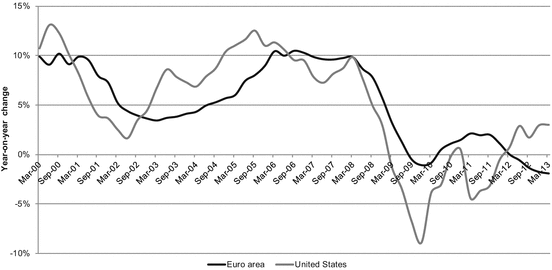

Fig. 9.2
Bank credit to the private non-financial sector. Source: Bank for International Settlements
The shipping market is also characterized by both excessive optimism and pessimism on the part of the market participants. This is expressed in the volatility of the vessel prices, freight rates, and the development of stock prices of shipping companies compared to the development of the economy and the stock market in general (see Fig. 9.3).
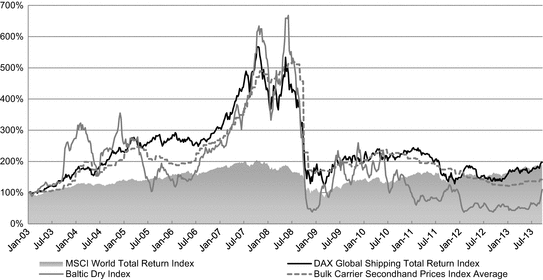

Fig. 9.3
Historical development of certain indices (indexed 1 January 2003). Source: Bloomberg, S&P Capital IQ, Clarkson Research Services
One reason for this high degree of volatility and the exaggerated market phases in the shipping markets is a delayed adjustment of the market supply to changes in the market demand, so-called pork cycles,2 which intensifies the general price fluctuations. Another reason is of structural nature: In the last market upswing attracted by tax advantages, favorable financing conditions (low credit margins) and prospects of high profits on the second-hand market the market participants showed excessive optimism with the result that more vessels than necessary were ordered with respect to the effective long-term market demand. Contrary to this, the market participants in the current shipping market trough are expressing excessive pessimism, leading to comparatively few loans and investments, despite expected strong future market demand. While the excessive optimism intensified the last market upswing, the resulting strong fleet growth in combination with the economic downturn in 2008/2009 have led to an excessive pessimism on the part of the market participants and a massive collapse of the market. However, both the scope of the upswing and the extent of the downswing do not reflect the realistic long-term market perspective.
Because of the shipping market environment market prices of comparable vessels are often distorted and the common market approach provides no reliable valuation results assuming a long-term going concern scenario. Instead, especially in phases of market disruption, valuation methods that are based on the long-term earnings potential of a vessel (income approach) are needed. This issue can be addressed by using the LTAV method; the general principles of this method are recorded in the Hamburg Ship Evaluation Standard (HSES).
9.4 The LTAV Method
9.4.1 Methodology
Considering only financial objectives, the value of a vessel is determined from the vessel’s ability to generate financial surpluses for the suppliers of capital, both equity and debt. The determination of the LTAV, according to the HSES, is based on the DCF method and the concept of weighted average cost of capital (the so-called WACC approach3), which is widely recognized in theory and the valuation practice. The LTAV of a vessel is derived accordingly by discounting the expected free cash flows (FCF t ) with the weighted average cost of capital (WACC):


(9.1)
The free cash flows can be derived using the forecast charter revenues (C t ) less the expected costs for operating the vessel (OPEX t ), as well as a residual value (RV T ) at the end of the vessel’s economic useful life.
9.4.2 Determination of Free Cash Flows
Charter revenues (C t )
Assumptions about the daily future charter rates that can be earned for hiring out the vessel (gross charter rates), about the incurred management fees and freight commissions, as well as about the utilization rate (operating days per year) must be made to forecast the (net) charter revenues accurately.
As the development of the free cash flows for the near future can normally be forecast with a higher degree of certainty than for later years, a detailed planning period of at least 3 years should be considered. Existing charter agreements should be taken into account when forecasting the charter revenues if the charterer has a reliable creditworthiness. If no charter agreement exists or if the vessel is to be valued for a specific purpose without consideration of an existing charter agreement, (time) charter rates that can currently be observed in the market are an appropriate starting point for forecasting the charter revenues for the detailed planning period. Shipbrokers (e.g. VHSS, Harper Petersen & Co.) as well as research companies (e.g. Clarkson Research Services) provide periodically (at least monthly) actual time charter rates or time charter equivalents for different charter periods (e.g. 1, 2, 3 and 5 year duration) for a wide range of vessel types. Based on the relationship between time charter rates with different durations it is possible to derive the market expectation of the future development of charter rates. In addition, market analyses with regard to the current fleet (volume and age profile) and the additional fleet capacity (order book) as an indicator for the expected market supply as well as market analyses with regard to the economic outlook as a proxy for the expected market demand support forecasts of charter rates for the detailed planning period. An analysis of the difference of current freight rates and future freight rates (based on forward freight agreements) can also provide further indications for the future development of the charter rates in the near future. Finally, projections of future charter rates for the detailed planning period can be retrieved from research companies, e.g. Maritime Strategies International (MSI), Drewry Shipping Consultants, and Marsoft.
Figure 9.4 shows different charter rate forecasts for a geared 1,700 TEU (Twenty-foot, the T in TEU stands for Twenty-foot equivalent unit) container vessel.

Fig. 9.4
Charter rate forecast for a 1,700 TEU (geared) container vessel as of 30 June 2013
Excursus: Sample market analysis: Market supply and market demand
To forecast charter rates for the detailed planning period, analyses of the current and expected market situations are important. Useful analyses should consider the fleet development (market supply) as well as the economic outlook (market demand).
Figures 9.5 and 9.6 summarize the deadweight capacity of the world cargo fleet and the volume of the order book (vessels ordered at shipyards) differentiated by main vessel types, as well as the expected increase of world trade volume, world oil demand and world GDP as of 30 June 2008 and 30 June 2013.
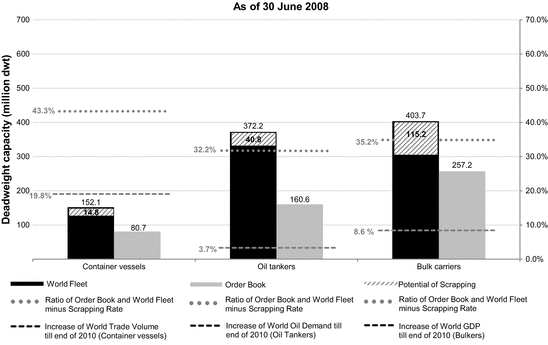
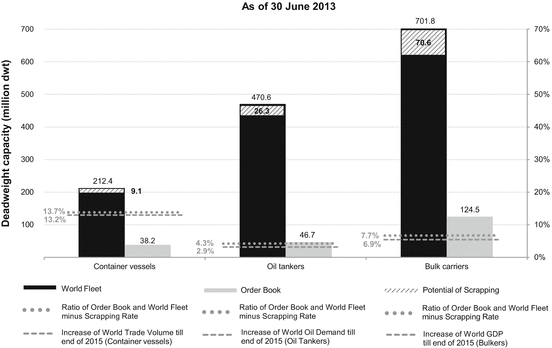

Fig. 9.5
Deadweight capacity of world cargo fleet and order book as of 30 June 2008. Source: Clarkson Research Services, The Economist Intelligence Unit, OPEC

Fig. 9.6
Deadweight capacity of world cargo fleet and order book as of 30 June 2013. Source: Clarkson Research Services, The Economist Intelligence Unit, OPEC
The analysis as of 30 June 2008 shows a substantial gap between the expected growth of market supply and market demand and thus an upcoming supply surplus. The ratio of the order book to the existing fleet less the expected scrapping rate (vessels older than 20 years as a percentage of the fleet) can be described as an indicator for the expected fleet growth. Assuming that the ordered vessels will be delivered over a period of approximately 2–3 years (up to the end of 2010), this indicator can be used as a proxy to estimate the growth of market supply up to the end of 2010. As of 30 June 2008, the projected fleet growth amounted to 43.3 % for container vessels, 32.2 % for oil tankers, and 35.2 % for bulk carriers. As opposed to this, the expected increase of world trade volume, world oil demand, and world GDP—good measures for the growth of future market demand—up to the end of 2010 were projected to amount to 19.8, 3.7 and 8.6 % respectively. Because of the fact that from the perspective of 30 June 2008, the projected market supply growth significantly exceeded the expected market demand growth, an appraiser should have anticipated an upcoming overcapacity of vessels, leading to a significant decrease in the charter rates, as effectively seen in the last years.
Conducting the same analysis as of 30 June 2013 illustrates a substantial reduction in the gap between the projected market supply and demand growths. According to the ratio of the order book to the existing fleet and the expected scrapping rate the projected fleet growth up to the end of 2015 will amount to approximately 13.7 % for container vessels, 4.3 % for oil tankers, and 7.7 % for bulk carriers. Within the same timeframe and according to market analysts, the expected increase of world trade volume, world oil demand and world GDP will amount to approximately 13.2, 2.9 and 6.9 % respectively. In comparison to the situation in mid-2008 the gap between projected supply and demand is distinctly lower indicating no further deterioration in future charter rates. Nevertheless fleet growth is projected to remain slightly above the growth level of worldwide demand indicators for the next years. Due to this the excess capacity of vessels will probably persist. As a result, for the three vessel types—as of 30 June 2013—a continuation of the shipping crisis appears to be likely in the near future with the result that overall the charter rates will probably not improve significantly—albeit not deteriorating further—at least in the short run. The above analyses can be further broken down to the level of specific vessel size classes. For such more detailed analyses it is necessary to take into account interdependencies between different vessel size classes. Thus, for example, larger vessels are expected to replace smaller vessels on some trade routes due to economies of scale (so called “cascading” effect).
After the detailed planning period and given the cyclicality of the shipping markets with high volatility of charter rates (see Fig. 9.7), a reference to long-term historical average charter rates—at least over the last 10 years—is usually appropriate when forecasting the charter revenues far into the future. To offset extreme values it could be necessary to widen the timeframe or to select the median instead of the mean to measure the average. To verify if the assumption that history repeats itself is realistic, the specific attractiveness of the vessel in the market must be considered. For this purpose, the long-term historical average could be compared to the long-term charter rate forecasts of research companies.
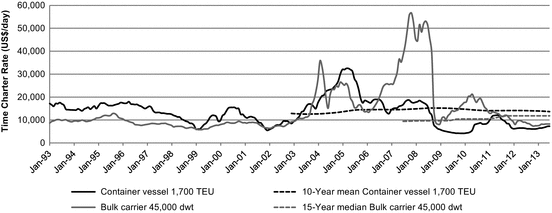
Fig. 9.7
Development of selected time charter rates (6–12 months; in $/day) between January 1993 and June 2013. Source: Clarkson Research Services
When forecasting the charter rates, expected increases in prices resulting from inflation should be considered to assure equivalency between the cash flow and the discount rate applied, as it is usually stated in nominal terms.4
Analyses of charter agreements show that compared to younger vessels older vessels often generate lower charter rates due to disadvantages in terms of efficiency (e.g. fuel consumption). This development should be reflected while forecasting charter rates. HSES recommends considering a discount when forecasting charter revenues for the periods when the vessel is older than 20 years. Experience shows that the charter rates for bulk carriers decreased by approximately 30 % and by approximately 15 % for container vessels and tankers.
Freight commissions and ship management fees are incurred when chartering. They usually amount between 1.25 and 5 % (freight commissions), respectively between 3 and 5 % (ship management fees) of the gross charter revenues.
For the estimation of the operating days of a vessel (utilization rate), a differentiation must be made between regular years of operations and years when the vessel is docked for renewing its class (normally every 5 years). In addition to the regular dry dock intervals, the forecast operating days must also take into account the other times when there is no operation (so-called off-hire times), for example, as a result of potential technical failures. HSES recommends 358 days of use in normal years and 343 days of use in class renewal years as a basis. Lower days of use might have to be taken into account due to expected additional off-hire times. The current shipping crisis has shown that due to excess capacity some vessels were not chartered and thus laid up. In such situations, a reduction of the usual utilization rate would have been reasonable.
Operating expenses (OPEX t )
The operating expenses mainly include costs for personnel (e.g. crew wages and provisions), insurance, lubricants and other stores, spares, maintenance, repairs, dockings and class renewals as well as for taxes. Payments for investments (e.g. due to environmental requirements) have to be considered as well under the operating expenses.
Due to increasing operating costs observed in the past and expected in the future, an orientation toward figures in the past when forecasting future operating costs is very questionable, contrary to the long-term forecast of charter revenues. Taking into account the current condition as well as the development of operating costs in previous years, the current operating costs should be used as a starting point for the forecast. Besides the current operating costs, the estimation in the detailed planning period should also consider expected new additional costs (e.g. investments due to environmental requirements). It must also be considered that the operating costs in class renewal years are higher by nature. For purposes of simplification, the costs for class renewals can be distributed on an annual basis.
In a manner analogous to forecasting the future charter revenues, future cost increases resulting from inflation should also be taken into account while forecasting operating costs.
Residual value (RV T )
To determine the residual value, reference to the scrap value at the end of the expected economic useful life (normally 20–25 years, Stopford 2009, p. 263) is appropriate. It is also important to take into account costs of disposal (e.g. commissions, costs of the voyage to the ship-breaking yard). When determining the scrap value, the light dis-placement weight of the vessel in (long) tons must be multiplied with the expected scrap price per (long) ton at the end of the economic useful life. As is the case with forecasting the future charter revenues and operating costs, the expected scrap value should also reflect price increases resulting from inflation.
9.4.3 Determination of the Discount Rate (WACC)
To value a vessel based on discounted cash flows, the expected free cash flows must be discounted to the valuation date using an appropriate discount rate. This rate is supposed to represent the required rate of return on an alternative investment which is equivalent to the investment in the respective vessel with regard to timing, risk, currency, and taxation of cash flows. As cash flows earned by vessels are usually denominated in USD, the discount rate should be determined as well based on US capital market data.