The Economic of Shipping Freight Markets

Chapter 7
The Economics of Shipping Freight Markets
Patrick M. Alderton* and Merv Rowlinson†
1. Introduction
The purpose of this chapter is to provide analysis of the many economic changes that have occurred in freight markets in recent decades. Whereas great technological leaps in container, bulker, tanker and Ro-Ro shipping were already well in train by the 1970s the three decades since have witnessed less evident, but equally forcible changes in the shape and composition of freight market supply and demand. The intention here is to build on the solid theoretical foundations of freight markets that the blossoming discipline of maritime economics had already provided by the 1970s. From this position, the critical changes that occurred in freight markets will be discussed and their impact on freight markets analysed. Additionally, the intention is to focus on the new trends already taking place in the freight market, including the increasing impact of environmental issues on the market.
The freight market can be defined as the place where the buyers and sellers of shipping services come together to strike a deal. Categorisation may be made in a number of ways. The charter market can be divided up into the following four main sectors: First, the Voyage Charter Market; under this type of contract the charterer hires the ship to carry his cargo for usually an agreed rate per ton. Most of the problems are for the shipowners with the major points of negotiation being the freight rate and the laytime (the time the charterer wants for cargo handling). For obvious economic reasons charterers will opt for this market when freight rates are high and when the expectations are that they will fall and when the demand of the commodity markets seems unstable. Second, The Contract of Affreightment Market (COA); this is a variation of consecutive voyage chartering or in other words a contract between owner and charterer to move so much cargo on a regular basis. No ship is named, which is an advantage to owners with large fleets or to owners who are members of a “pool”. Third, Time Charter Market; this market can be split into short, medium and long period of times. Prior to 1970 many tramp owners would have a good percentage of their fleet under long-term (say 15-year) charters. This gave stability to their business as they could estimate their income for long periods of time. However when many accepted long-term charters in the boom year of 1970 they suffered financially in the period of inflation that followed in 1973. Since then the majority of the market has been in short- and medium-term charters. In this type of contract the charterer becomes the disponent owner and has to accept many of the problems that might arise, so the negotiations will usually be more complex. Finally, Bareboat Charter Market; under this contract the shipowner will lease the bare ship to the charterer who for practical purposes will operate the vessel as his own. However, in this market often standard contract forms are seldom used so the actual conditions will vary, though the contract can be for a long period of time, often for the life of the ship. It can be used as a way of financing a ship, particularly in a period when shipowning enjoys certain tax advantages, as in such situations financiers can enjoy the benefits of shipowning without the problems of having to operate the vessel. In addition the charter market manufacturers and traders with significant annual volumes to move may express a preference for directly owned, vertically integrated tonnage.
The plan of work provided here outlines the nature and composition of shipping freight markets in the 1970s and the theoretical framework constructed by the new school of maritime economists in this era. The dramatic technological and operational changes to freight markets in the 1970s were well in train. Oil markets were becoming a dominant force in global shipping as the seemingly insatiable oil demand by developed industrial nations was accelerated by unin terrupted world growth (up until the late 1970s), post-World War II. The increased demand, coupled with increasing tonne-mile factors brought about by growth in long-haul oil trades, proved conducive to radical developments in vessel size. Economies of scale were the economic zeitgeist of this period as tanker and bulker sizes soared upwards. Equally dramatic changes were occurr ing in the cargo liner sector, with capital intensive fully cellular and Ro-Ro ves sels replacing the traditional labour intensive cargo liner. During this period the dominance of North America and Europe in world trades was being supple mented by the dynamic industrial growth of Japan, with Korean industry begin ning to register as a world force.
Building on the theoretical framework which was well established in the 1960s by the burgeoning school of maritime economists, this chapter considers new developments in freight markets. Whereas great technological leaps in design – containerisation, massively increased sizes in the tanker and dry-bulk and tanker sectors, Ro-Ro shipping – accompanied by a revolution in operational practice, occurred in the decade post-1960, later decades have been much less dramatic. However a number of areas in the freight market have under gone significant change. The intention is to explain the change process by analys ing the shifts in the demand and supply of shipping within the context of freight market changes. Though it is perhaps too early to determine what the effects of the EU banning the liner conference system will have on the liner and general cargo shipping market.
This is followed by a statistically based analysis of the principal changes to aggregate freight markets in the past four decades. The fundamentals of derived is revisited within the context of these changes. Whilst it is not proposed to challenge the main precepts of demand, it is important to recognise that important new developments have affected specific freight markets. Trends of industrialisation and de-industrialisation have wrought changes to the pattern of demand. Additionally unforeseen events shaping the global political economy have impacted on the freight market.
Finally, the concept of “green shipping” is discussed within the context of eased environmental concern during the last few decades. Empirical evidence drawn from the operations (and accidents) of contemporary shipping will be analysed within the context of the fast evolving green agenda, as well as the economic pressures of the post-credit crunch market. The intention is to explain the change process via the utilisation of a broad-based range of economic and organisational theory. This should not only contribute to the understanding of change but also endorse the value of theory which will deepen analysis of the dynamics of restructuring and strategy in the industrial transi tion process.
2. The Theoretical Framework
The key determinants of demand for sea transport were clearly defined by Chrzanowski.1 These are:
- the volume and quantity of cargoes to be transported;
- the distance of transport.
The basic tools for meeting this demand were met by a mixture of charter market and directly owned tonnage. The essential question this raises is what type of allocative process was best suited to meeting these demands. The market mechanism was clearly favoured by leading maritime economists. By the 1970s the economic principles determining freight markets had been rigorously defined by the new wave of maritime economists. From this period a strong tradition of neo-classical economic analysis has been maintained in maritime economics. With the emphasis on cost competitiveness in open freight markets, maritime economists have argued for the efficacy of market forces. Svendsen’s 1958 work2 provided a seminal analysis of the neo-classical micro economics of freight markets, stressing the essential comparative costs of shipping and their importance in attaining competitiveness in the global market. Thorburn3 effectively employed supply and demand analysis to develop a detailed model of shipping freight markets, identifying some 36 supply and 24 demand conditions to be found in the working marketplace. Goss4 reflected the emerging macro factors which were beginning to affect shipping markets by the late 1960s. The changes in the world political order during this period led to the market model of open freight markets being challenged. The once colonial nations were beginning to pressurise for more economic independence which included the ownership and management of merchant shipping. Additionally, open registry tonnage was becoming a major force in the world fleet. Both trends were to prove difficult for traditional owners in the USA and in Northern Europe. Protectionism in the freight market was seen as an effective response to these difficult conditions. Goss was to question the efficacy of resorting to protectionism, particularly where it negated the benefits of the competitive markets.5 Goss’ position on the open market has been a consistent feature of the maritime literature. In 1993, he was to counter calls for interv ention in the freight market:
“International shipping services are commonly bought and sold in competitive markets which lead to the survival of those with the lowest private costs… the relevant principle is that of comparative advantage.”6
Gilman7 heralds the great leap in technology and innovation “that facilitated the container revolution. Focusing on such major liner routes as the North Atlantic and Transpacific, Gilman credits the great economic gains of con tainerisation on the competitive process which ensured that leading lines would strive for ever-increasing efficiency. Jansson and Schneerson identified the benefits of a rigorously competitive shipping liner industry, one optimises the most economic use of the global supplies of capital and labour:
“The best division of labour in international sea transport is obtained when the most efficient operators become price leaders.”8
3. Changes in Freight Markets
3.1 World trade from 1840–2000
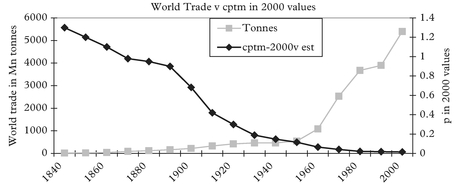
World trade in the form we know it today started in the middle of the nineteenth century as global communications developed. Before that what the ship brought back from her voyage depended on the commercial ability of the master or the discretion of the owner’s agent. As London became the communication centre of the world it became the trading centre of the world.
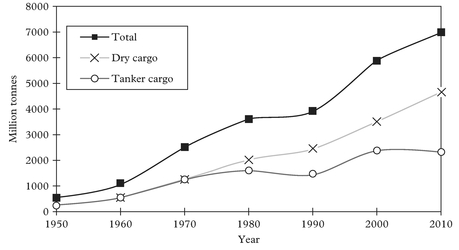
Figure 1 shows that although world trade has faltered from time to time it has continued to grow. Note also how after World War II from the mid-1950s growth in demand dramatically increases and the modern trend of maritime transport can be considered to have started.
Figure 1 also shows the general increase in world trade since World War II apart from a plateau in the 1980s caused by a slight decline in the oil trades in that period. Since then the growth has followed the same buoyant trend established in the 1960s.
3.2 Main specific markets post-1970s
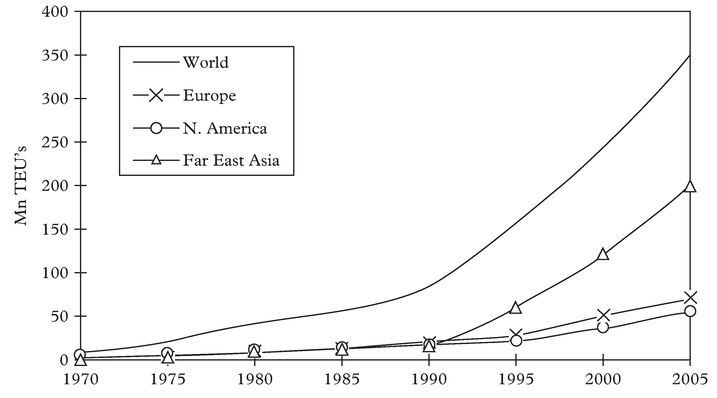
Figure 2 shows the growth in the world container traffic from 1970–2005 and illustrates that although the global growth has been consistently increasing (until mid-2008), the growth has varied in the three main trading regions. In 2000 World Container Ports handling increased by 8.7% but in South-East Asia and South America growth would be nearer 25%. Note that some 20% of container traffic is empty containers.
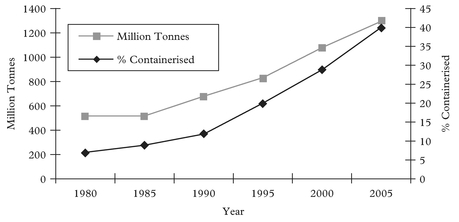
Figure 3 indicates the percentage of general cargo that is containerised in the global situation. At many of the major ports in the developed countries that percentage may be well into the 90s.
3.3 The dry bulk trades
In 1937 total seaborne trade of all mineral ores was 25m tonnes.
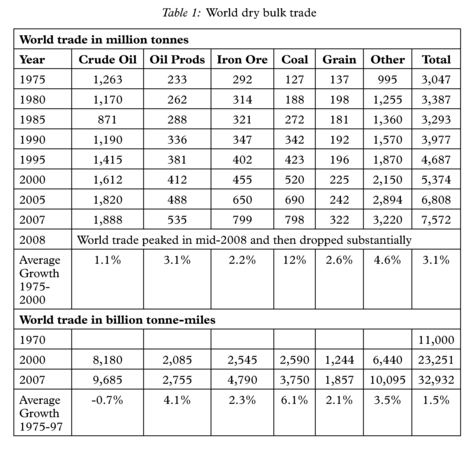
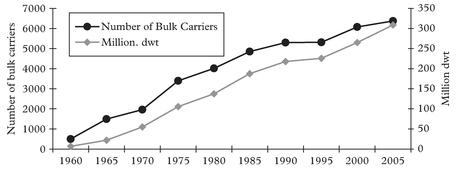
Demand due to post-war reconstruction caused trade to boom during the 1950s helped by re-armament, the (Korean war) and increased consumer demand, in particular by the motor car industry. During the 1960s the bulk carrier fleet increased from seven to 70m dwt. During the last few years iron ore, coal and grain have accounted for some 65% of seaborne dry bulk cargo movements. Other important bulk cargoes include bauxite, sugar, wood, wood pulp, wood chips, fertilisers and cars (full cargoes such as cars and packaged lumber are sometimes referred to as neo-hulk cargoes). See Table 1.
3.4 Tanker cargo
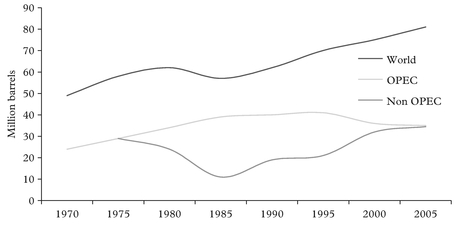
Following the 1973 oil price rise it became economic to develop indigenous sources of supply which is reflected in Figure 5.
Source: BP Statistical Review of World Energy
Source: Compiled from a variety of sources from the oil industry for the Oxford Encyclopaedia of Maritime History by author
If India and China increase their energy per capita to only half that of say Europe or Japan the demand in this sector will be tremendous. See Table 4.
3.5 Derived demand revisited
The intention now is to consider some of the specific demand factors that have altered the freight market in recent decades. The concept of derived demand serves to define and predict the nature and pattern of demand for shipping. Key determinants of
demand have been clearly identified by maritime economists. These include: the level and location of economic activity, distance factors, population levels and trend factors. In the last three decades derived demand has been affected by the pattern of deindustrialisation in the mature economies. This has been reflected by changes in such staple trades as coal, iron ore and steel. The run down of the coal mining industry in Northern Europe has created a heavy demand for the deep-sea carriage of steam coal. Australian, Chinese, Columbian, South African and North American coal exports have benefited by the new international division of labour. The economics of such long haul trades are facilitated by the comparative costs of sea transport. Table 4 and Figure 6 illustrates the cost competitiveness of sea transport over long distances. The assumptions made here are based on representative cost between the three transport modes:
- Imported South African Coal: Voyage Chartered Capesize Vessel, 180,000 dwt Richards Bay-Clyde, >6,000 nautical miles.
- UK Mined Coal: Rail Central Scotland-Central England Merry-go-round train. 15 trucks, 200 miles approx. Payload 45 tonnes per truck.
Table 4: Comparative tonne-mile costs
| Mode | Sea | Rail | Road |
| Rate per tonne | $6.5 | $7.7 | $9.0 |
| Rate per tonne-mile | .001 | .002 | .007 |
Source: UNCTAD Review of Maritime Transport
Source: Data collected from several sources
- (3) UK Mined Coal: Road Central Scotland-Central England Tipper Truck, 200 miles approx. Payload 25 tonnes.
Developments in the inland German Port of Duisburg clearly reflect the deindustrialisation process. The run down of the giant Krupp steel complex not only reduced demand for regionally produced coal but also the import of iron ore via the ports of Rotterdam and Antwerp. The transformation of Duisburg into a centre of logistics now emphasises the growth of container flows through the port.
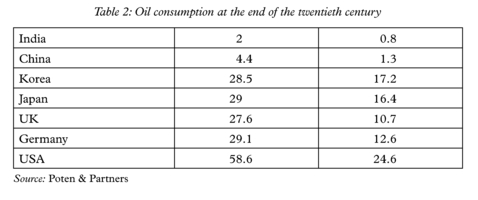
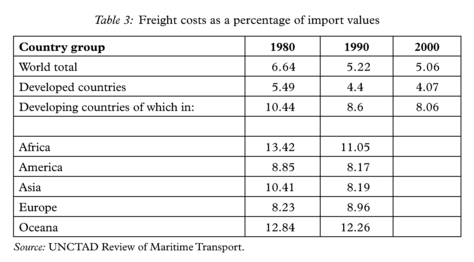
The switch of heavy industry to the Far East has also had a similar impact on the demand for coking coal. See Tables 2 and 3.
3.6 The impact of changes in the political economy
Freight markets have also been affected by unforeseen changes in the political economy. The impact of the ending of the Cold War, the welcoming of South Africa back into the world trade network and the inexplicable decline of the industrial giants of Japan and Korea.
In the 1970s the growth of the Soviet bloc fleet posed some concern for Western Defence strategists. Fearful that the low cost of the socialist ships would enable them to penetrate crucial freight markets, it was argued that the socialist ship-managers did not have to pay insurance charges and benefited from low cost East European labour and fuel supplies. On some key liner routes socialist ships were charging rates up to 65% lower than con ference rates.9 The rapid collapse of Communism following the periods of Glasnost and Perestroika in the late 1980s has led to a drastic reduction of consumer power as the ex-command economy struggled to achieve a market mechanism. An obvious casualty has been the market for North American grain imports. The normal shortfalls in the Soviet wheat harvest provided a sizeable market for American and Canadian grain. The impoverishment of the economy means that there is little consumer purchasing power and that the state lacks the hard currency to make large scale bulk purchases, regardless of the poor state of the nation’s diet.
Another unanticipated outcome of the collapse of the ex-Soviet economy has been the relinquishment of large volumes of merchant shipping into world trade routes. Additionally, the collapse of the Soviet bloc economies in the late 1980s saw large amounts of ageing tonnage and low cost crews entering into the open market. Particularly noticeable has been the incursions of’ the Russian Volga barges into the trades. These vessels usually named Lagoda were originally intended for the calmer waters of the Volga these vessels can now be seen in the less clement waters of the North Sea, the Irish Sea and the Bay of Biscay. Whilst the Eastern bloc seamen had hitherto enjoyed a sound world wide reputation for professionalism, the substandard conditions and ships they now find themselves has diluted their craft status. Typical of the plight of these seamen is the example of the 20 crew of the 740 TEU vessel, Hannes C. Composed of a mix of Russian, Romanian, Ukrainian and Filipino, the feeder vessel’s crew found themselves dependent upon the Antwerp Port Chaplains and their Seafarer Centre. The lay-up of their vessel, following the financial collapse of the vessel’s owners, stranded the crew without pay, food and fuel, resulting in extreme conditions on board. Emergency supplies of clothing, blankets, food, water and fuel were supplied to the vessel by the Antwerp Seafarers’ Centre.10 This is just one example of numerous incidents occurring in ports around the world involving the impoverishment and marginalisation of seafarers in the global market.
The impact of changes in the international political economy is currently being felt in the Far East, particularly the impact of China’s trade liberalisation and the transfer of Hong Kong to the Peoples’ Republic of China as a Special Economic Region.
3.7 Supply
The supply of shipping is made up of the carrying capacity of ships to move cargo. This is made up of three main factors.
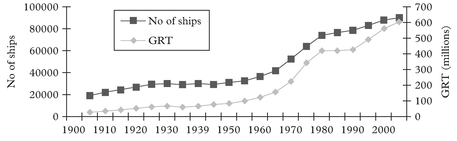
Ships Ships have consistently grown bigger over the last century. The growth was slow from 1880 to 1955 but from 1955 to 1975 it was spectacular, as owners realised the possibilities of new technologies and trade routes. In 1975, the last of the ships ordered before the oil crisis ended the boom of the early 1970s, were being constructed. Since then the situation has stabilised – tankers, for instance, have not grown any bigger, but ferries have. The number of ships: over the last century the num ber of ships which carry things has declined but the total tonnage of ships has greatly increased. The reason for this is their size. See Figures 7 and 9.
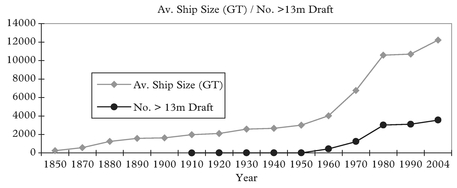
Figure 8 indicates that the depth of water was not a major issue until the 1960s. Even in 1950 Rotterdam still had only ten metres. In 1970 there were only eight ports in Europe which could accept the new class of VLCC tankers and there were no ports with sufficient depth of water on the east coast of North America. By 1975, following a period of energetic dredging there were 22 ports in north-west Europe which could accept such ships. Dredging is a very expensive activity and the question facing port
managers is: “Will ships continue to get bigger?” Figure 8, showing average ship size since 1850, does indicate a levelling off in average ship size after 1980. If the average of the five largest tankers are considered for each year it can be seen tanker size peaked around 1975. If the same exercise is considered for dry bulk carriers their size seems to have peaked around 1985–1989. If so, should one dredge the old channel or develop a new terminal in an area which enjoys deeper water?
Port time The less time ships spend in port the more cargo they can carry in a year – hence reducing port time increases the supply of ships.
Speed Increasing speed obviously increases the supply of ships and vice versa. This is the only way supply can be adjusted in the short term apart from laying ships up and reactivating them. Few marine engines allow wide variations of speeds, but reducing speed two or three knots can show significant economies, so “slow steaming” can be a valid strategy in the attempt to balance supply and demand or to reduce propulsion costs in periods of high hunker costs, as seen in the late 1970s and early 1980s.
Perhaps a more useful analysis is to consider the supply from the different types of vessels.
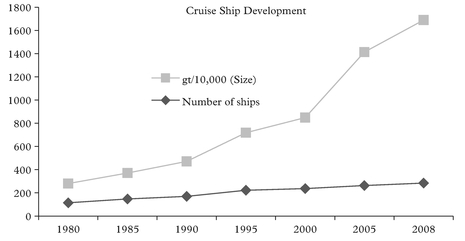
Originally cruise ships tended to be relatively small catering for say less than 500 passengers as they needed to be able to manoeuvre in and out of the smaller historical and romantic ports on the “traditional” cruise itinerary.
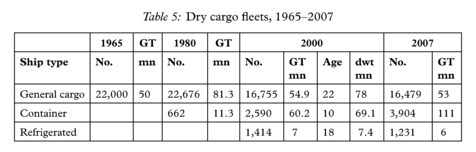
3.8 General cargo and container ships
Lloyd’s List, January 2001 uses the term ULCS (Ultra Large Container Ships) of ships of 9,000–10,000 TEU capacity. Also proposed terms–Suezmax container ship 12,000 TEU, Malaccamax 18,000 TEU.
In 2006 the Estelle Maersk had 170,794 gt, 158,000 dwt and could carry 12,500 TEU.
However in 2007 a spokes person for the Port of LA said that LA would prefer two 6,000 box ships a week rather than an 8,000+ vessel, due to the strain the latter put on the inland distribution services.
In 1998 there were only some 36 container ships with drafts greater than14 metres. From the 3,000-box ship of 1972, container ship size did not increase any further until 1982 when the 4,000 box ship was introduced.
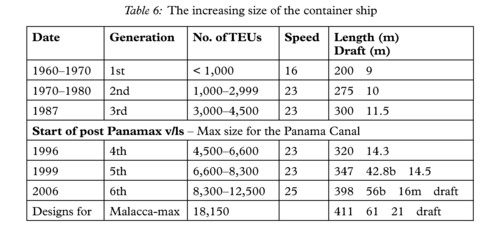
From there another size plateau was sustained until the early 1990s when the 6,500-box ship appeared. As ships’ beams increase, cranes must also increase in size. This involves an increase in weight and there comes a point when the terminal cannot take the extra load without considerable civil engineering expense. As ships’ drafts increase, depth of water in ports becomes a problem. Virtually all major ports have 10 metres, but few can offer over 15 metres.
For large ships to maintain the same schedules as their smaller brethren cargo-handling speeds will have to be increased. From this it follows that the terminal area wiIl need to be increased and the inland distribution facilities improved. Increasing the size of ships may well also increase the peaking factor which can be a serious cost problem for a centre hub port.
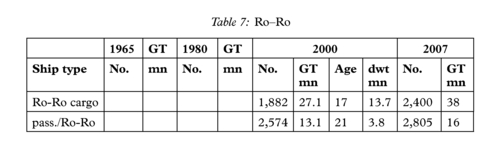
The term “Ro-Ro” can cover a variety of ships such as car ferries, specialist vehicle carriers, of which over 50% are owned by the Japanese, and general cargo ships which are described as having Ro-Ro capability. These Ro-Ro ships are expensive: a 15,000 dwt size would be about twice the price of a conventional ship of this size and the “wasted space” can be considerable but their productivity is very high and their extreme flexibility – virtually anything can be rolled on, containers, heavy loads, large objects, etc. – makes them attractive to operate. These ships have also been referred to as STO/ROs in cases where the cargo is rolled on board by forklift trucks which stow and handle the cargo as in a warehouse. Ro-Ros have also proved very useful in areas where congestion has occurred.
It was originally considered that Ro-Ro was only suitable for short distances many such ships have been operating for years between Europe and Australia and across the Pacific – there are also ships which are part cellular containership and part Ro-Ro. See Tables 5, 6 and 7.
3.9 The dry bulk carrier
A bulk carrier is a large single deck ship, say > 10,000 dwt which carries unpackaged cargo. Statistics concerning bulk carriers may not be always consistent as different authors and different times will arbitrarily determine at what a single decked vessel will classed as a bulk carrier. The term bulk cargo is however simply unpackaged cargo that can be poured, tipped or pumped into the holds or tanks of the ship.
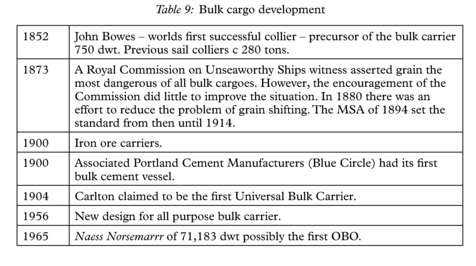
Although there have been colliers for centuries carrying bulk coal and grain and various ores have also a long history of bulk carriage, the modern concept of a variety of bulk cargoes being loaded and discharged quickly into single deck “open hatch” dry cargo ships from modern terminals equipped for handling bulk cargoes, dates only from the mid-1950s.
Shipping textbooks written in the 1940s and early 1950s refer to bulkers but these seemed to have been on the Great Lakes or part of a vertically integrated operation. Like container ships they were born of economic necessity. Tramp freight rates were very depressed though demand was increasing after the Korean war, so a cheaper means of carrying bulk cargoes had to be found. Also technically it was not possible to build open hatch ships much before this date. In 1962 there were only 21 bulk carriers over 40,000 dwt and the world total of bulk carriers was only 611.
The particular design features of a bulk carrier are the single deck, a large hatchway and wing tanks. The upper wing tanks are shaped to give a conical transverse section to the hatch, so that when bulk cargo is being poured in the amount of “trimming” is reduced as the cargo is being loaded. When loading bulk cargoes the danger has always been that the upper corners of the hold would be left empty with the consequent danger of the cargo shifting in bad weather.
The large bulk carriers usually trade between special terminals and therefore seldom have any derricks or lifting gear. Smaller bulk carriers have to be pre pared to discharge anywhere so will usually have their own gear. Technology to improve the handling of bulk cargoes had been around since the end of the nineteenth century. For instance in 1888 grabs were mentioned for discharging grain in London as an alternative to grain elevators and by 1935 there was an ore-discharging plant in Rotterdam.
The popular sizes are:
- 10,000-25,000 dwt – these are some times referred to as “handysize” as they can trade to most ports in the world though 20,000 dwt is about the largest size that can use the St Lawrence Seaway. There were some 77.4 million dwt in this class in 2000.
- Handymax are 35,000-50,000 dwt vessels. There were some 45.5 million dwt in this class in 2000.
- Panamax class, the largest size that can use the Panama Canal. This is about 65,000 dwt as the limiting lock width is just over 105 feet (32 metres) and with
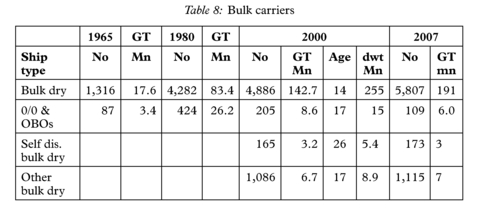
- a maximum LOA of 950 feet (289.5 metres). This class is important as much of the ore trade is through the Panama Canal. There were some 70.5 million dwt in this class in 2000. Note it is anticipated that the Panama Authorities will in the next decade or so increase the size of locks so the Panamax vessel will increase in size.
- Capesize bulkers, which are 100,000-180,000 dwt and are used mainly for ore and coal on specific routes between well-equipped terminals. There were some 86.6 million dwt in this class in 2000.
- VLBC, bulkers greater than 180,000 dwt, of which most are trading between Australia & Japan. See Tables 8 and 9 and Figure 10.
3.10 The oil tanker market
As can be seen from Figure 5 there has been a considerable correlation between tanker supply and demand, though after the oil price rise in 1973 there was, in the short term, a reduction in demand which left, for that period, an excess of supply.
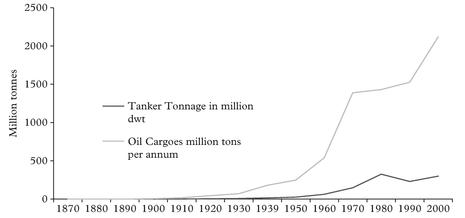
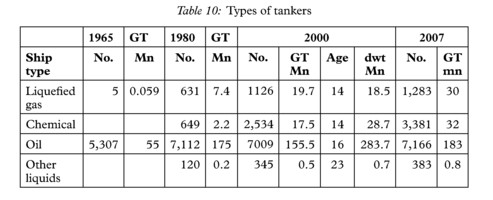
Until around 1950 much of the oil produced was refined at source and the refined products transported to the consumer. However, the shift in the political control of many oil sources, such as in 1951 when the oil refineries of the Anglo-Iranian Oil Co were nationalised, led to many countries, for strategic reasons, refining the oil at destination instead. (Some argue that the main reason for the change in the position for refining was the rapid development of the chemical industry at this time.) Whatever the reason, the early 1950s saw significant changes. For instance between 1938–1956 oil consumption increased almost four times in western Europe whereas refinery capacity increased almost nine times. One obvious effect was a large increase in tanker cargoes in the 1950s and 1960s, as the oil was now carried twice, first as crude oil from source to refinery and then to distribute the refined oil. This development saw an increase in tanker size in general, which led to the specific dedication of a class of tankers as Crude Oil Carriers. At the end of World War II, 16,000 dwt was considered a large tanker, whereas by the end of the 1950s there were 100,000 dwt tankers (the largest that could traverse the Suez Canal loaded). By the end of the 1960s when the Suez Canal was closed, the VLCC of 250,000 dwt became a standard size and in 1972 the first of 500,000 dwt was launched.
At the same time there was an increase in the number of tanker owners independent from the major oil companies. Before World War II the oil companies owned 70% of the tanker fleet and the independents 30%.
In the late 1970s Saudi Arabia built two 25 million-ton oil refineries which started to reverse the trend of the 1950s. By the mid-1970s, the situation had reversed with the oil companies owning only 30% of the tonnage, and since then this percentage has been steadily decreasing. By 1998 the independents owned 72%, oil companies 10% and governments 15%, with the final small percentage being owned by traders. This growth of independents has naturally meant a growth in tanker chartering.
The above graph shows considerable correlation between tanker supply and demand, though after the oil price rise in 1973 there was in the short term a reduction in demand, which left an excess of supply for that period. The steep rise in oil prices in 1973 meant an increase in the power of OPEC (Organisation of Petroleum Exporting Countries), with a consequent reduction in the power of the large oil companies’ tanker fleets in oil-trading and the growth of oil traders speculating in the market. These oil traders then formed a large proportion of tanker charterers and so affected tanker chartering in several ways. The traders would buy a shipload of crude oil and try to sell the oil at a profit during the voyage. Thus much tanker chartering is “open-ended” i.e.