Soil Carbon Stocks and Fluxes

Fig. 8.1
On the left side a, coverage distribution of the different data sources used in this study. On the right side b, climatic subdivision of the Italian territory. Letters indicate the different climate types: 33 Temperate sub oceanic, 37 Temperate subcontinental to temperate continental partly mountainous, 38 Warm temperate sub continental, 42 Mediterranean oceanic to Mediterranean sub oceanic partly mountainous, 43 Mediterranean sub continental to Mediterranean continental, 44 Mediterranean to sub tropical, 45 Mediterranean mountainous
The climatic subdivision of the Italian territory was done following the “Georeferenced Soil Database for Europe: Manual of Procedures Version 1.1. Eur 18092 EN” (Finke et al. 1998). Accordingly, the Italian territory was classified in seven areas with a different type of climate (Fig. 8.1b). The CORINE Land Cover 2000 (Sinanet 2009), the climatic database, the soil C stock databases and the Ecopedological map, were overlayed using the ESRI ARC/GIS software thus enabling the climate and soil-land-use combinations to be defined. The mean SOC stock value was consequently calculated for each cropland land use type combination. An analysis of variance was made (ANOVA), to statistically compare the SOC stock means, clustered according to the different climate regions, land use types and landscapes.
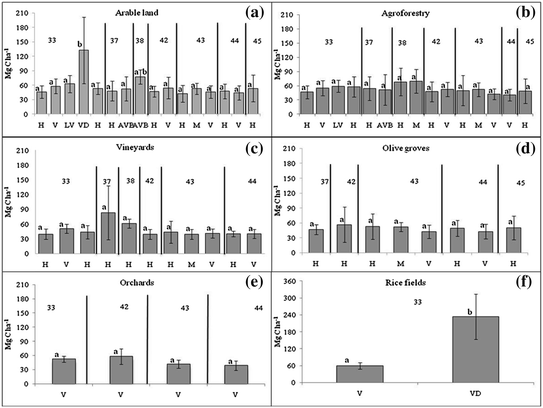
The land use types “arable land” and “agroforestry” are the only being present in all of the different climatic regions of Italy. The arable land SOC stock does not show substantial differences between the different climate types with an amount of SOC comparable to those of the agroforestry subcategory with a SOC stock varying from 40.1 ± 2.3 Mg C ha−1 in the Mediterranean subtropical region to 69.8 ± 25.3 Mg C ha−1 in the temperate mountain one (Fig. 8.2).


Fig. 8.2
SOC stock (2000) in the top 30 cm mineral soil of the subcategories Arable land, Agroforestry, Vineyards, Olive groves, Orchards and Rice fields under the different type of climates: temperate sub oceanic (33), temperate subcontinental to temperate continental partly mountainous (37), warm temperate sub continental (38), Mediterranean oceanic to Mediterranean sub oceanic partly mountainous (42), Mediterranean sub continental to Mediterranean continental (43), Mediterranean to sub tropical (44), Mediterranean mountainous (45). H hills; V valley; LV low valley; VD valley depression; AVB alluvial valley bottom; AV alluvial valley; M mountains. Bars represent the standard deviation. Different letters indicate significant difference (p < 0.05)
Vineyards’ SOC stock varies from 39.2 ± 10.0 Mg C ha−1 on mountains relief of the warm Mediterranean sub continental type of climate, to 82.8 ± 54.9 Mg C ha−1 on the hills of the warm temperate sub continental type of climate (Fig. 8.2). The olive groves subcategory is obviously present only in the most typically Mediterranean type of climates with no significant statistical differences (p < 0.05), with SOC stock values varying from 42.1 ± 13.3 Mg C ha−1 in the lowland of the Mediterranean sub-continental to continental type of climate, to 56.0 ± 35.0 Mg C ha−1 in oceanic type of climate and in the Mediterranean sub-oceanic. The orchards’ SOC stock varies from 38.1 ± 9.9 to 57.8 ± 16.4 Mg C ha−1 while the rice category is varying from 60.1 ± 11.1 to 234.4 ± 80.3 Mg C ha−1 (Fig. 8.2).
8.3 Trends in Cropland SOC Stocks Variations
The subdivision in different land uses for the cropland category in 2000 is functional to assess the impacts on the SOC stock due to land use changes from and to agricultural uses, providing the starting or ending point scenario. In the literature few works distinguish the SOC stock under the different cropland subcategories. The comparison with the values reported for Spain by Murillo (2001) indicate the presence of similar stocks in the top 30 cm of some subcategories such as for arable lands (from 50.8 ± 33.7 to 57.6 ± 36.3 Mg C ha−1), for vineyards (42.5 ± 28.9 Mg C ha−1) and for olive groves (39.9 ± 28.3 Mg C ha−1), respectively. Similar stocks were reported also by Martin et al. (2010) for France: about 49.3 ± 26.2 Mg C ha−1 for agricultural soils, about 48.1 ± 24.3 Mg C ha−1 for orchards and 39.4 ± 26.5 Mg C ha−1 for vineyards. Contrasting the total mean value of the whole cropland category estimated in this study, 53.2 ± 22.2 Mg C ha−1 obtained by taking into account each subcategory value and its relative surface in 2000 (ISTAT 2010), with other estimates at national level indicate similar SOC stocks. For Belgium, Sleutel et al. (2006) set the average SOC stock for cropland soils (0–30 cm) at 50–61 Mg C ha−1, while Smith et al. (2001) suggested value of 53 Mg C ha−1 in an average estimate of all European croplands. On the other hand, for Kyoto purposes the required data are not the SOC stocks but the dynamics of the soil carbon pool. In particular it is required the average carbon flux in the base year (1990), that has consequently to be compared with the average flux during the period 2008–2012.
Looking at the SOC dynamics of cropland soils at Italian level, the SOC stock in the 1990 for the whole cropland category can be taken from the work of Fantappiè et al. (2010) that report the data of the upper 50 cm of mineral soil derived from different surveys at country level from 1979 to 1998 obtained from the National soil database (Costantini et al. 2007). Accordingly, a derived value of 54.8 ± 12.2 Mg C ha−1 for the upper 30 cm of soil in the 1990 suggests a variation of 0.16 Mg C ha−1 y−1 when compared with the stock estimated in this study for the year 2000, 53.2 ± 22.2 Mg C ha−1. A small decrease in the SOC stock from 1990 to 2000 would be in agreement with the loss rates of 0.2 Mg C ha−1 y−1 reported for Italy by Janssens et al. (2005), calculated by multiplying country specific C sequestration rates, estimated by the CESAR model (Vleeshouwers and Verhagen 2002), with the average surface area reported by Mucher (2000) and FAO (http://www.fao.org/waicent/portal/statisticsen.asp). To our knowledge, there are only two large-scale (national) and long-term inventories of C in agricultural soils that can be used to compare these SOC loss rates. In a study by Sleutel et al. (2006), repeated sampling of cropland soils in Belgium (210,000 samples taken between 1989 and 1999) indicate an average annual soil C loss of 0.8 Mg ha−1 y−1, while Dersch and Boehm (1997) in a large-scale inventory study estimate for Austrian croplands, a net C loss of about 0.2 Mg ha−1 y−1. Also at European level, a net loss of SOC is observed for cropland soils and can be mainly related to the harvesting that reduces C returns to soil, and to agricultural practices such as tillage (Janssens et al. 2005).
8.4 Increasing the Size of the Soc Stock for the Cropland Category
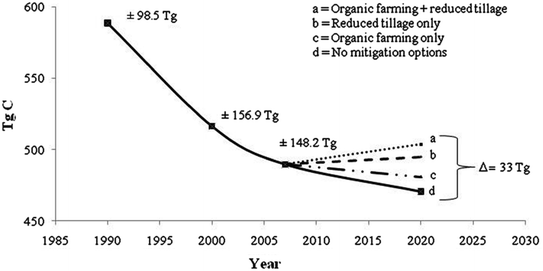
To increase the size of the cropland SOC pool, and at the same time reducing the emission from soil, it is important to take into account the different mitigation options. In fact, trying to increase the size of the soil C stock means increasing the C input, decreasing the output or a combination of the two through improved management. Carbon sequestration can also occur through a reduction in soil disturbance because more C is lost from tilled soils than from soils that are less disturbed. Measures for reducing soil disturbance include reduced or zero tillage systems, set-aside of lands and the growth of perennial crops. Measures for increasing soil C inputs include the preferential use of animal manure, crop residues, sewage sludge, improved rotations with higher carbon inputs to the soil, and in some cases fertilisation/irrigation management to increase productivity. According to Freibauer et al. (2004) and to Smith et al. (2000a, b), the impact of such practices can be estimated: for example permanent set-aside or zero tillage might result in a maximum C sequestration potential of 0.4 Mg C ha−1 y−1, the use of perennial crops or deep rooting crops in 0.6 Mg C ha−1 y−1, while changing from conventional to organic farming result in a sequestration potential of 0.5 Mg C ha−1 y−1. A practical example for Italy can be done considering the 2007, the more recent year for which ISTAT report the areas occupied by the different cropland subcategories (ISTAT 2010). The average SOC stock in 2007 can be obtained by applying the annual SOC net loss rate of 0.16 Mg C ha−1 y−1 estimated in this study to the average SOC stock found in 2000 for each subcategory and multiplying the resulting stocks for the area each subcategory occupy. This calculation results in a total SOC stock for the whole cropland category of 489.7 ± 148.2 Tg C (Fig. 8.3). Consequently some future scenarios can be hypothesised (e.g. for 2020) assuming no further variations in the area occupied by each subcategory.


Fig. 8.3
Simulation of the impact of different mitigation options on the total SOC stock of the whole cropland category from 2007 to 2020. Numbers indicates the standard deviation of the SOC stock measured in the different years
In 2007, the ISTAT report that about half of the surface occupied by arable lands (3.48 Mha) is currently ploughed. About 60 % of this area is ploughed between 20 and 30 cm, while about 10 % is ploughed to more than 40 cm. Assuming a decrease of the ploughing depth to 20 cm for the 70 % of the ploughed arable land area (2.43 Mha), and applying the corresponding C sequestration factor for reduced tillage, the amount of C sequestered in 2020 would be 10.4 Tg C, corresponding to 0.8 Tg C y−1. Making a comparison with the 2007 SOC stock and considering that the other subcategories continue to lose C at the same rate, the increase in 2020 for the whole cropland category is 5.2 Tg C (Fig. 8.3). The improvement of organic farming is another interesting option to increase SOC stock in croplands. In fact, in Italy the area occupied by organic farming represents only 5 % of the total agricultural surface. It is worth nothing that, at European level, the size of organic farming soil is even less, about 2 % of the total agricultural area (Rounsevell et al. 2002), and Italy alone has 27 % of European Union organic land (EC 2001). A 2 % increase of the area occupied in 2007 by organic farming (0.5 Mha) is leading to an increase of about 0.8 Tg C y−1 until 2020, not enough to change the negative trend of the whole cropland category. In fact, despite the similarity in the accumulation rate with reduced tillage option, the loss of C from the other subcategories has to be considered, bringing to an estimate for the total SOC stock in 2020 of 480.9 Tg C, 8.8 Tg C less than the amount in 2007 (Fig. 8.3). Combining the two mitigation options change the negative trend of SOC from the cropland category, leading to a total SOC stock in 2020 of 503.6 Tg C, 13.9 Tg C more than in 2007. More important, in 2020 the increase resulting from combining reduced till age and organic farming mitigation options will be about 33 Tg C more than the amount hypothesisable if no mitigation options are planned, about 470.5 Tg C (Fig. 8.3