Singapore
Economic growth is accompanied by structural change, however many of the sectors which continue to make significant contributions to the Singapore economy have legacies related in one way or another to Singapore’s location on international shipping routes and the foresight of Sir Stamford Raffles who founded Singapore in 1819 and established it as a free port. Examples include shipping, ship-repair and associated services such as finance and insurance; petroleum refining and the associated petro-chemical value chain. The availability of engineering skills which facilitated structural change toward manufacturing after 1965 is also attributed to the presence of rubber milling and tin refining in the late nineteenth and early twentieth century. The growth of many of these sectors was due to technological changes and fortuitous events that took place elsewhere, but which had a considerable impact on the development of Singapore.
Factors which contributed to the development of the port and ancillary activities include the opening of the Suez Canal in 1869, which gave Singapore an edge compared to other ports in the Malayan peninsula such as Penang and Malacca.[6] A second development was the advent of the steamship. The increase in vessel size reinforced the importance of larger ports such as Singapore and led to the development of a hub and feeder system. By the First World War, Singapore’s port was the seventh busiest in the world in terms of shipping tonnage handled. After independence, the Government made an early bet by setting up a container terminal in the early 1970s; much before container shipping was well established. In 2010, Singapore’s port was the second busiest container port in the world (after Shanghai), handling about 28.4 million twenty-foot equivalent units (TEUs).
Singapore is also a leading centre in the world for ship repair, tanker repair and the construction of petroleum drilling rigs and support ships. The development of these industries can also be traced back to the early twentieth century. By 1913, Singapore had five dry docks—the fifth (King’s dock) was built to the specifications of the Admiralty as the British established a naval base in the north of Singapore in 1928. When the British left Singapore in 1967, the shipyard was taken over by the Government which used the infrastructure for the ship repair industry.
The development of related industries and other ‘clusters’, although linked to the development of the port, are also explained by Singapore’s vast hinterland. Huff argues that in the late nineteenth century and until 1960, Singapore was a ‘staple port’ or one which exported surplus natural resources from the hinterland.[7] In the late nineteenth century, tin was exported from the Malayan peninsula and, later in the 1920s, rubber from Malaya and petroleum from the Dutch East Indies. Favourable geography was a necessary condition for staple ports and this led to an expansion of facilities required to handle a greater volume of goods and shipping. Other requirements included entrepreneurial, investment, management and mercantile functions connected with the staple—which essentially turned the port into a commercial centre.
Between 1874–77 and 1896–99, Malayan tin production increased more than sixfold, growing from one fifth to over one half of world output due to demand for tin plate in the West, which was attributed to two innovations: canned food and the use of barrels for transporting petroleum. By 1899–1900, the world’s largest and most technically sophisticated tin smelting facility was located in Singapore and the port was also the world’s largest exporter of tin.
In the inter-war period, Singapore was the largest centre in the region for re-milling small-holder rubber. The demand for rubber and petroleum increased due to demand for motorised transport. Between 1913 and the 1930s, the United States imported half to three quarters of world rubber production. The auto industry accounted for three quarters of rubber imports into the United States. The market for petroleum also got a boost due to the conversion of mercantile marine fleet to oil-fired ships. After the First World War, oil majors developed production facilities in British Borneo and the Dutch East Indies and used Singapore to collect, blend and distribute products such as petrol, kerosene and fuel oil for bunkering. Oil companies were drawn to Singapore because of its local and international geographical advantage and freedom from regulation. Petroleum exports were four times greater in volume in the 1950s than in 1937–38. The Royal Dutch Shell Group maintained its headquarters for its Far East shipping fleet in Singapore. In 1959 Caltex started marketing operations; oil refining started in 1960 and by 1980 Singapore was the largest bunkering centre in the world.
Government built on legacy industries such as shipping, ship-repair and petroleum refining and the linkages of tin refining and dry docks to the local engineering industry provided a skill base which allowed Singapore to move to a model of export-led growth based on heavy foreign direct investment (FDI) after the 1960s.
Between 1988 and 2001, the ratio of Singapore’s total trade (goods and services) to GDP fluctuated between 3.0 and 3.5, however, since 2002, this ratio has increased more or less monotonically and it stood at about 4.5 (3.5 for goods and one for services) in 2008. Total merchandise trade increased from US$43 billion in 1980 to $658 billion in 2008, representing an annual growth of 10.2 per cent. Export growth of goods (at 10.75 per cent per annum) outpaced growth in imports (9.69 per cent) over the period of 1980 to 2007. Entrepöt trade is an important component of Singapore’s trade. In 2008, re-exports accounted for 42.62 per cent of Singapore’s total exports. Growth in re-exports accounted for 51.13 per cent of total export growth between 1990 and 2008. Singapore’s re-exports are dominated by high-tech products, and this pattern has become more pronounced over time. The share of high-tech products in total re-exports increased from 63.22 per cent in 1995 to 67.17 per cent in 2008. The other important product category is petroleum and related products.
Foreign investment accounts for about 80 per cent of gross fixed capital formation in Singapore. This is one of the highest rates in the world, with only Hong Kong relying even more on foreign capital to finance investment. As a proportion of GDP, FDI inflows doubled from 82 per cent in 1991 to 171 per cent in 2007. Traditionally, manufacturing and financial services attracted most of the FDI inflows. Since 2004, finance has outpaced manufacturing as a target for FDI. Western foreign firms continue to dominate investments in the manufacturing sector with the United States continuing to be the leading investor. In 2007, local investment accounted for 28 per cent of gross fixed investment in the manufacturing sector; the United States accounted for 29 per cent; Japan for 16 per cent and European countries for another 18 per cent. These shares have remained remarkably stable since 1997. Table 2 shows that foreign investors continue to be attracted to Singapore due to the high returns they obtain from their investments.
Table 2: Profitability of FDI in Selected Industries
Industry | Return on Investment | FDI Inward Stock | |||
2001–07 | 2007 | in 2007 | Growth (01–07) | ||
Banking Services | 41.3% | 35.1% | 11,31 | –4.5% | |
Instrumentation, Photographic & | 40.6% | 40.9% | 2,765 | –26.0% | |
Pharmaceutical Products | 22.4% | 38.9% | 47,435 | 19.4% | |
Water Transport Services. | 21.5% | 19.2% | 26,941. | 12.1% | |
Insurance Services | 20.4% | –2.8% | 10,059. | –1.0% | |
Refined Petroleum Products. | 20.1% | 41.9% | 14,148. | 2.8% | |
Chemicals & Chemical Products. | 18.8% | 17.0% | 6,837 | 42.1% | |
Electronic Products & Components | 18.6% | 17.6% | 28,241 | –15.3% | |
Transport Equipment | 18.0% | 25.0% | 3,564 | 30.3% | |
Wholesale Trading Services | 16.6% | 23.4% | 72,116 | 10.6% | |
Machinery & Equipment | 14.8% | 16.6% | 5,180 | 32.5% | |
Other Financial Services | 12.7% | 27.1% | 13,450 | –27.1% | |
Warehousing, Post & Courier Services | 11.6% | 10.8% | 3,187 | 2.6% | |
Rental & Leasing Services | 7.6% | 5.0% | 5,511 | –22.6% | |
Real Estate Services | 7.2% | 26.3% | 12,179 | 6.8% | |
Business Services | 6.8% | 13.8% | 16,239 | 28.3% | |
Hospitality and Food Services | 5.1% | 8.4% | 3,006 | –5.6% | |
Investment Holding Services | 4.6% | 6.5% | 157,363 | –0.6% | |
Information and Communications | 3.8% | 15.4% | 4,754 | 36.9% | |
All Industries/Total | 14.00% | 17.8% | 457,024 | 3.5% | |
Sources: Foreign Equity Investment in Singapore (2005–2007 editions), all published by the Singapore Department of Statistics.
While Singapore maintains an open trading environment, the domestic economy is not led by the local private sector, but is one in which the Government and multinationals play a substantial role. Local small and medium scale enterprises (SMEs) only dominate general manufacturing and real estate and business services; all other sectors are dominated by foreign firms or large (generally government-linked) local firms. There are various estimates of the number of government-linked companies (as many as 600) and their contribution to GDP (from 13 to 60 per cent), however they are just estimates as many government-linked companies are exempt from filing public accounts.[8] Table 3 shows that foreign firms generate higher revenues and net income per employee than either government-linked or local private firms.
Table 3: Financial Statistics of Singapore’s 1,000 Largest Companies
2008 Financial Indicators, S$ per employee | ||||
GLC | Non-GLC | Foreign | All Firms | |
Revenues | 542,321 | 381,369 | 2,387,977 | 905,950 |
Net Income | 105,632 | 48,817 | 132,375 | 80,461 |
Source: Singapore Top 1000, provided by the DP Information Network Pte Ltd.
Note: Domestic firms include government linked companies (GLC) and private domestic firms (non-GLC).
Singapore is often cited as an example of ‘state capitalism’ where government uses various tax and other incentives to both attract foreign investment and to direct investment to ‘targeted’ sectors. The process of structural change is more a matter of state direction rather than an outcome of market forces. Young argues that this fast pace of structural change comes at the cost of low total factor productivity, which is the driver of sustainable economic growth.[9] At an aggregate level, however, the structure of the economy shows remarkable stability. Over the period 1990–2008, the share of the manufacturing sector in total output (or GDP) has remained at about 25 per cent and this is not by accident but by design. Over the same period, the employment share of manufacturing declined from 30 to 20 per cent, reflecting the shift to higher value-added sectors (or sectors with higher capital intensity). However, the most important sectors continue to remain the same and include petroleum, chemicals, pharmaceuticals, electronics, transport equipment and machinery and equipment. In 2007 these sectors accounted for 85 per cent of the gross output of the manufacturing sector and 88 per cent of manufacturing exports. The share of the services sector in GDP increased from 60 to 66 per cent and the employment share of services increased from 62 to 67 per cent. Wholesale and retail trade was the largest service sector contributing to 16 per cent of output and 14 per cent of employment in 2008, while financial services accounted for 13 per cent of output.
While Singapore’s broad strategy remains the same, over the years government has used various policy levers to encourage the transition to higher value added industries in manufacturing, followed by a push toward the service sector and more recently toward innovation-intensive sectors such as biotechnology, water and clean technologies. Often, these and other changes are driven by exogenous factors and events; for example, the deregulation of telecommunication in 2000 was brought forward by two years to remain competitive with Hong Kong.
B. International Innovation Rankings
In recent years there has been a proliferation of rankings and their popularity has risen as well. It would appear that everything can be reduced to a single number, including measures of the quality of governance and judicial systems. Nonetheless, there appears to be considerable interest in rankings and countries such as Saudi Arabia and Kazakhstan have used them to set national objectives. Saudi Arabia, for example, sought to be ranked in the top 10 in the World Investment Report, the World Bank Doing Business Rankings or the World Economic Forum Global Competitiveness Rankings by 2010.[10] The Saudi Government also hired strategy consulting firm Monitor Group to help it achieve this objective. Generally, rankings are of limited use from a prescriptive or policy viewpoint; however they could be used as a quick-and-easy benchmarking tool. Unfortunately, as is shown below using innovation rankings, this can sometimes prove challenging. Data, methods of aggregation and metrics differ across rankings and understanding these requires deconstructing the rankings. Doing so, however, defeats the purpose of constructing them in the first place.
The World Bank’s ‘Knowledge Index’ and ‘Knowledge Economy Index’ measure a country’s ability to generate, adopt, and diffuse knowledge.[11] The former is based on three pillars: use of information and communications technology (ICT); education and human resources and the innovation system. The latter includes an additional pillar: economic incentive and institutional regime. Use of ICT is measured by per-capita penetration of computers, telephones and the internet. Educational attainment is measured using adult literacy rates, as well as enrolment in secondary and tertiary education. The innovation system measure is based on US patent grants, royalty payments and bibliometric data. These three measures are aggregated to arrive at the Knowledge Index. In 14th place, Taiwan was the highest ranked Asian country in 2009, while Singapore ranked 26th. Singapore’s ranking was dragged down by the education metric on which it ranks 70th. Adding the economic pillar which includes measures of tariff and non-tariff barriers, the quality of regulation and the rule of law, helped Singapore’s standing as its rank in the Knowledge Economy Index was 19th, or second in Asia, just after Taiwan (18th).
Most other cross-country comparisons of innovation use the notion of innovation inputs and outputs and in addition some include measures of the innovation environment. The Economist Intelligence Unit-Cisco Innovation Index uses this approach.[12] Innovation output is measured by patents granted by the European, Japanese and US patent offices. Innovation inputs include measures of R&D expenditure, educational and technical skills and the quality of ICT infrastructure. The innovation environment is measured by factors such as policies towards trade and investment, the political environment, taxes, availability of financing, the labour market and infrastructure. In constructing the index of ‘innovation enablers’, innovation inputs are given a higher weight (75 per cent) than indicators of the innovation environment. Based on 2004–08 data, Singapore ranked second (after Denmark) on environmental factors, but its overall rank on both enablers, as well as output or ‘innovation performance’, was 16th. Japan was in first place whereas Taiwan was ranked seventh and South Korea 11th.
In 2009, The Boston Consulting Group (BCG), the National Association of Manufacturers, and the US Manufacturing Institute released an international innovation index comparing innovation inputs and performance across countries.[13] The scope of both measures is very wide and includes measures of economic growth, employment growth, the level of taxation, high-tech exports and labour productivity. Singapore ranked first overall on innovation inputs, but it ranked ninth on innovation output and performance. While it is highly implausible that Singapore is the most innovative country in the world, these results point to Singapore’s inefficiency in producing innovation outputs. For example, Singapore’s innovation input score was 2.74, whereas that of Hong Kong was 1.61. Yet, Hong Kong’s (ranked sixth overall) innovation performance score was 1.97 compared to Singapore’s score of 1.92.
INSEAD (The European Institute of Business Administation) and the Confederation of Indian Industry released their third global innovation rankings for the year 2009–10.[14] Innovation inputs were measured using five pillars: institutions, human capacity, general and ICT infrastructure, markets sophistication and business sophistication. Innovation outputs included scientific outputs, creative outputs and benefits to social wellbeing. Many of the measures drawn from the Global Competitiveness Report data and data on creative outputs are drawn from the United Nations Conference on Trade and Development (UNCTAD) which includes production and exports of tangible products or hardware used in creative industries including compact discs, music players, etc.[15] Overall, Iceland was ranked the most innovative country and Hong Kong was third, followed by Singapore (seventh), United States (11th) and Japan (13th). Singapore’s rank on the input and output pillars was third and 12th respectively.
The 2009 Innovation Index of the Information Technology and Innovation Foundation (ITIF) in the United States also gives a large weight to indicators of economic performance.[16] These include general economic business environment indicators such as trade balance, foreign direct investment, corporate tax rates and the World Bank’s doing business rankings and new business registration data. Singapore was ranked first—or the most innovative country in the world; South Korea fifth and the United States sixth. Singapore had low ranks in areas such as e-government (21st), scientific publications (22nd) and broadband (14th).
Generally, Singapore ranks reasonably well (in the top 20) in international innovation rankings and its standing is higher in indices which include either general economic metrics such as tax rates, economic growth, export performance and ability to attract FDI or business environment metrics, such as the costs of doing business. Singapore also does well in rankings which include measures of government support for innovation. However, Singapore tends to perform better on measures of innovation inputs than on outputs. The next section provides comparative data on more specific metrics of innovation outputs such as patents, trademarks and copyright registrations.
C. Innovation Metrics
Innovation is a complex phenomenon and not just restricted scientific R&D activities. Firms may make process and organisational innovations and increasingly customers and other business partners are playing an important role in collaborative or open innovation. Ultimately, to fuel economic growth, innovation should lead to commercialisation or the introduction of profitable new products, services, or methods of delivery. Singapore is moving toward an innovation-based economy and government has devoted a considerable amount of funds to R&D since 2000. Innovation is difficult to measure so researchers rely on readily available IP registration data as measures of output and R&D expenses and personnel as measures of inputs into the innovation process.
Table 4 shows Singapore’s global share of IP including patents, trademarks, industrial designs and utility models or petty patents. While Singapore’s share is small, it appears to have made some progress. Its share of approved patents increased from 0.18 per cent in 2001 to 0.62 per cent in 2007—a factor of three. Approved trademarks also increased from 0.24 per cent in 2001 to 0.66 per cent in 2007.
Table 5 shows the average (2001–07) number of approved patents, trademarks and industrial designs and also presents more recent data on a per-capita basis (per 10,000 population). So, for example, about 748 patents on average were granted to Singapore residents over the period 2001–07, which translates to about 1.62 patents per 10,000 population. In general, Singapore looks somewhat similar to Ireland; it does better than Hong Kong on all measures except industrial designs, but is generally behind OECD and Scandinavian countries. US-registered patent data (Table 6) show that Singapore’s patenting rate per-capita (per-million population) is comparable to countries such as Denmark and the Netherlands. However, countries like Finland, Israel, Switzerland, Japan, South Korea, and Taiwan continue to outperform Singapore. Singapore has shown strong growth, but on this measure, countries such as India and China have outpaced Singapore by a factor of two to three. Despite the recent push towards new areas such as biotechnology, Singapore has a strong focus on electrical engineering, which is very similar to South Korea and Finland (Table 7).
Singapore amended its IP laws about a decade ago and trademarks, industrial designs and patents can since be registered at the Intellectual Property Office.[17] Table 8 provides data on filings and approvals in Singapore and filings and approvals by Singapore residents. In other words it asks: which are the top five countries that file (and get approved) for intellectual property in Singapore? In which countries do Singapore residents file (and get approved)? For patents, the United States and Japan and the top applicant countries in Singapore, whereas for trademarks and industrial designs, Singapore residents are the top applicants followed by either the United States or Japan. Singapore residents show a clear domestic preference for obtaining trademarks and industrial designs, but they prefer to file for patents in the United States.
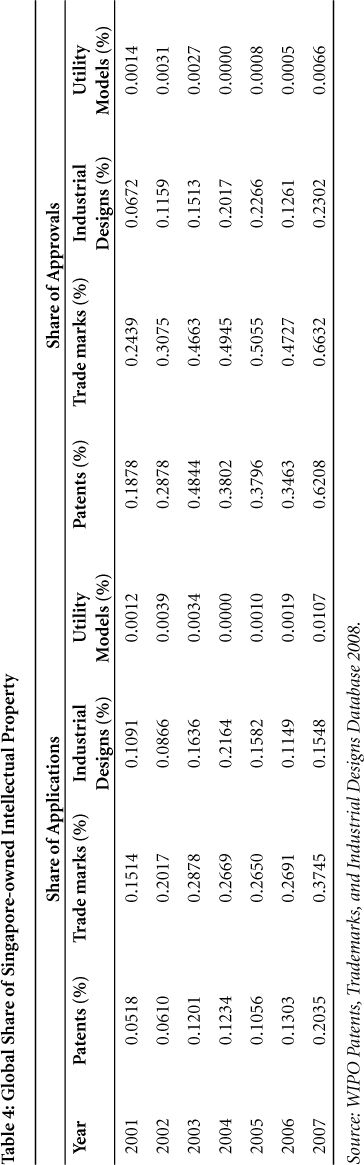
Table 5: Comparison of Granted Intellectual Property to Residents
Country | 2001–2007 average | per 10,000 population in 2008 | |||||
Patents | Trademarks | Industrial | Patents | Trademarks | Industrial | ||
Denmark | 2,131 | 8,107 | 610 | 3.89 | 14.78 | 1.11 | |
Finland | 4,103 | 4,850 | 842 | 7.82 | 9.25 | 1.61 | |
France | 23,302 | 47,695 | 32,543 | 3.73 | 7.63 | 5.21 | |
Germany | 50,430 | 137,664 | 52,008 | 6.10 | 16.66 | 6.29 | |
Hong Kong | 312 | 6,937 | 2,275 | 0.44 | 9.88 | 3.24 | |
Ireland | 872 | 2,285 | 164 | 2.10 | 5.50 | 0.39 | |
Japan | 192,448 | 109,090 | 38,637 | 15.12 | 8.57 | 3.04 | |
Netherlands | 8,488 | 5,761 | 1,525 | 5.10 | 3.46 | 0.92 | |
Norway | 1,151 | 2,464 | 286 | 2.48 | 5.30 | 0.62 | |
Singapore | 748 | 5,740 | 564 | 1.62 | 12.46 | 1.22 | |
South Korea | 60,385 | 45,630 | 29,887 | 12.48 | 9.43 | 6.18 | |
Sweden | 7,606 | 11,187 | 1,160 | 8.41 | 12.37 | 1.28 | |
Switzerland | 8,501 | 49,882 | 11,704 | 11.21 | 65.79 | 15.44 | |
United Kingdom | 13,314 | 40,136 | 4,605 | 2.18 | 6.59 | 0.76 | |
United States | 142,258 | 206,385 | 22,372 | 4.68 | 6.79 | 0.74 | |
Source: WIPO Patents, Trademarks, and Industrial Designs Database 2008.
Table 6: US Patent Ownership, 2008
Utility patents owned | Per million population | Avg. Annual Growth 1999–2008 | |
World | 157,772 | 23.10 | 0.31% |
United States | 77,501 | 246.16 | –0.88% |
Japan | 33,682 | 264.89 | 0.88% |
Germany | 8,915 | 108.50 | –0.51% |
South Korea | 7,549 | 156.19 | 8.35% |
Taiwan | 6,339 | 275.92 | 6.00% |
France | 3,163 | 50.74 | –2.10% |
United Kingdom | 3,094 | 50.26 | –1.61% |
Netherlands | 1,329 | 80.10 | 0.71% |
China | 1,225 | 0.91 | 29.01% |
Israel | 1,166 | 162.63 | 5.01% |
Switzerland | 1,112 | 146.94 | –1.55% |
Sweden | 1,060 | 114.60 | –3.10% |
Finland | 824 | 154.72 | 2.65% |
India | 634 | 0.53 | 19.26% |
Singapore | 399 | 84.23 | 11.32% |
Denmark | 391 | 71.48 | –2.44% |
Hong Kong | 311 | 44.29 | 7.74% |
Norway | 273 | 56.73 | 2.20% |
Ireland | 164 | 36.32 | 6.67% |
Source: USPTO Databases.
Table 7: WIPO-Registered Patent Applications by Field of Technology (2002–06)
Electrical | Mechanical | Instruments | Chemistry | Other | Total | |
World | 31.32 | 23.20 | 17.30 | 23.82 | 4.37 | 3,236,551 |
China | 28.47 | 17.80 | 17.54 | 32.65 | 3.54 | 146,646 |
Denmark | 8.88 | 22.49 | 21.04 | 44.70 | 2.90 | 3,594 |
Finland | 46.61 | 23.21 | 9.96 | 18.58 | 1.65 | 28,837 |
Germany | 18.03 | 35.55 | 15.33 | 27.60 | 3.49 | 159,822 |
Ireland | 17.86 | 20.08 | 23.56 | 33.31 | 5.19 | 2,408 |
Japan | 36.67 | 24.29 | 17.29 | 17.42 | 4.33 | 1,344,446 |
Netherlands | 38.32 | 16.22 | 16.61 | 25.57 | 3.29 | 58,829 |
Norway | 15.06 | 36.30 | 15.75 | 28.12 | 4.77 | 3,097 |
Singapore | 49.95 | 12.32 | 19.30 | 15.94 | 2.49 | 6,695 |
South Korea | 49.61 | 19.32 | 12.29 | 13.11 | 5.65 | 372,435 |
Sweden | 23.68 | 26.24 | 20.40 | 26.92 | 2.77 | 24,904 |
Switzerland | 10.43 | 22.86 | 24.00 | 38.74 | 3.97 | 15,077 |
United | 19.55 | 22.42 | 20.55 | 31.59 | 5.89 | 49,405 |
United States | 30.70 | 17.29 | 18.95 | 28.88 | 4.17 | 757,589 |
Source: WIPO Statistics Database, July 2009.
Table 8: Intellectual Property filed in Singapore and by Singaporeans (2001–08)
Patents filed in Singapore | Patents filed by Singaporeans | |||||||
Top Country Appliers | Top Country Holders | Top Countries Applied | Top Countries Held | |||||
USA | 29.58% | USA | 32.47% | USA | 39.63% | Singapore | 46.79% | |
Japan | 11.86% | Japan | 17.94% | Singapore | 33.67% | USA | 38.71% | |
Singapore | 7.05% | Germany | 16.03% | EPO | 5.97% | EPO | 5.75% | |
Germany | 4.40% | Singapore | 5.54% | China | 4.58% | Japan | 1.66% | |
Switzerland | 3.26% | UK | 5.17% | Australia | 3.20% | China | 1.13% | |
All others | 43.85% | All others | 22.84% | All others | 12.95% | All others | 5.96% | |
Total Filed | 61,065 | Approved | 47,354 | Total Filed | 12,785 | Approved | 5,236 | |
Industrial Designs filed in Singapore | Industrial Designs filed by Singaporeans | |||||||
Singapore | 23.12% | Japan | 23.62% | Singapore | 71.72% | Singapore | 73.85% | |
Japan | 22.18% | Singapore | 22.02% | USA | 7.76% | USA | 5.47% | |
USA | 8.44% | USA | 8.87% | China | 5.96% | China | 5.35% | |
Switzerland | 8.08% | Switzerland | 7.83% | Japan | 2.17% | France | 3.52% | |
Netherlands | 3.71% | Netherlands | 3.79% | OHI (EU) | 1.85% | Australia | 2.20% | |
All others | 34.46% | All others | 33.86% | All others | 10.55% | All others | 9.60% | |
Total Filed | 13,588 | Approved | 13,236 | Total Filed | 4,381 | Approved | 3,947 | |
Source: WIPO Patents, Trademarks, and Industrial Designs Database 2008.
Table 9: Innovation Input Trends in Singapore
Year | Research scientists & engineers per | GERD per capita (current S$) |
1994 | 38.50 | 342.76 |
1995 | 47.70 | 385.72 |
1996 | 50.10 | 488.02 |
1997 | 53.40 | 553.50 |
1998 | 57.80 | 638.30 |
1999 | 62.60 | 669.47 |
2000 | 66.10 | 745.53 |
2001 | 65.90 | 784.59 |
2002 | 67.50 | 811.06 |
2003 | 73.80 | 800.71 |
2004 | 80.90 | 932.94 |
2005 | 90.10 | 1,035.36 |
2006 | 87.40 | 1,115.21 |
2007 | 90.40 | 1,392.29 |
2008 | 87.60 | 1,546.84 |
Source: A*Star’s ‘National Survey of R&D in Singapore 2008’.
Singapore has made great strides in strengthening its research inputs, particularly over the last decade or so. Table 9 shows a consistent increase in both spending and personnel since 1994. Research scientists and engineers per-thousand of the total labour force increased at an average annual rate of 5.9 per cent from 1994 to 2008 and R&D expenditures per capita grew at 10.8 per cent per annum over the same period. In absolute terms, however, some corporations have a larger R&D spend than Singapore. In 2007, gross expenditure on R&D (GERD) in Singapore was S$6.34 billion, with the private sector accounting for about two-thirds (S$4.23 billion) of the expenditure. In contrast, Sony Corporation which was ranked 20th in a global survey of corporate R&D spending, reported R&D spending of about S$6.8 billion in 2007.[18]
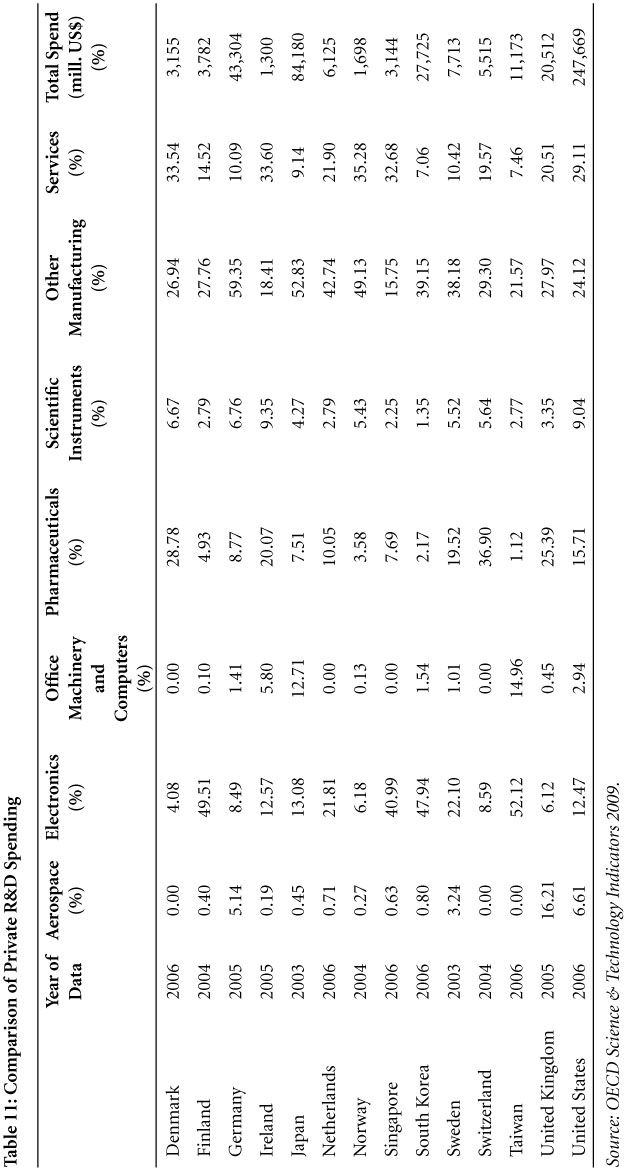
In 2008, the Government’s share in total R&D spending in Singapore was about 18 per cent, which was higher than in OECD countries and slightly lower than in Taiwan (Table 10). In comparison, the share of higher education in total R&D spending (9.9 per cent) was almost equivalent to that of South Korea and among the lowest in comparison to all OECD and Scandinavian countries. About half of all R&D spending is focused on the electronics sector and within that sector an overwhelming proportion of the expenditure is on semiconductors. Further, most of the R&D expenditure is on experimental development, rather than on applied or basic research—basic research is minimal. There is little evidence that private R&D spending has gone into ‘new’ areas like biotechnology, where the Government has made major investments. As shown in Table 11, countries such as Taiwan and South Korea also have a focus on electronics, whereas OECD countries such as Germany, Japan, the United Kingdom and the United States have a much more diverse research portfolio. Tables 12 and 13 show that Singapore compares quite well to OECD countries on both R&D researchers and personnel, but the focus appears to be on the former as Singapore’s researcher population (10.22 per 1,000 employed workers) places it in the top four, ahead of every Asian country except Japan. Singapore also has comparatively more public institute research personnel per 1,000 employed workers than any other country except the United Kingdom.
Table 10: Comparison of R&D Spending
Country | Year | Private | Higher | Government & | Total Spending |
Denmark | 2007 | 64.92% | 27.49% | 7.59% | 2.54% |
Finland | 2008 | 72.31% | 19.01% | 8.68% | 3.41% |
France | 2007 | 63.18% | 19.17% | 17.66% | 2.08% |
Germany | 2007 | 69.95% | 16.33% | 13.72% | 2.53% |
Ireland | 2008 | 66.96% | 26.04% | 6.99% | 1.42% |
Japan | 2006 | 77.16% | 12.69% | 10.15% | 3.39% |
Netherlands | 2007 | 60.42% | 26.55% | 13.04% | 1.73% |
Norway | 2007 | 51.25% | 32.83% | 15.93% | 1.57% |
Singapore | 2008 | 71.83% | 9.96% | 18.21% | 2.77% |
South Korea | 2006 | 77.26% | 9.95% | 12.79% | 3.23% |
Sweden | 2007 | 72.73% | 21.07% | 6.20% | 3.63% |
Switzerland | 2004 | 73.74% | 22.90% | 3.36% | 2.90% |
Taiwan | 2006 | 67.50% | 12.23% | 20.27% | 2.58% |
United Kingdom | 2006 | 61.65% | 26.12% | 12.22% | 1.78% |
United States | 2007 | 71.91% | 13.26% | 14.83% | 2.68% |
Sources: OECD Science & Technology Indicators 2009 and A*Star’s ‘National Survey of R&D in Singapore 2008’.

Table 12: Comparison of Researchers (Full Time Equivalent per Thousand Employees)
Country | Year | Private Sector | Higher | Government | Public | Overall |
Finland | 2007 | 8.83 | 4.87 | 1.80 | 0.14 | 15.64 |
Japan | 2006 | 7.53 | 2.87 | 0.52 | 0.13 | 11.05 |