Poverty in Italy and Generative Welfare Approach

Relative poverty
Absolute poverty
2011
2012
Perc. change 2011–2012
2011
2012
Perc. change 2011–2012
North
Poor households
601
760
+26.5 %
454
677
+49.1 %
Poor individuals
1,634
2,157
+32.0 %
1,096
1,783
+62.7 %
Centre
Poor households
318
358
+12.6 %
203
256
+26.1 %
Poor individuals
936
1,121
+19.8 %
491
684
+39.3 %
South and Islands
Poor households
1,863
2,114
+13.5 %
640
792
+23.8 %
Poor individuals
5,603
6,284
+12.2 %
1,828
2,347
+28.4 %
Italy
Poor households
2,782
3,232
+16.2 %
1,297
1,725
+33.0 %
Poor individuals
8,173
9,563
+17.0 %
3,415
4,814
+41.0 %
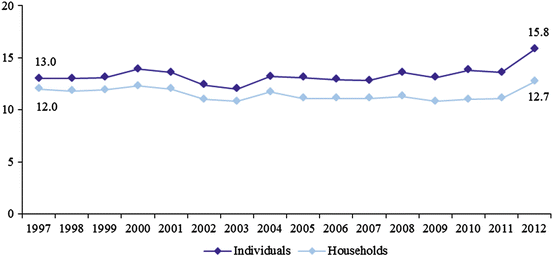
To properly understand the scope of poverty in Italian society, the number of poor should be compared with the overall number of residents. By doing so, the incidence of relative poverty turned out to equal 12.7 % among households (3.2 million relatively poor households) and 15.8 % among individuals (9.6 million relatively poor individuals) in 2012 at the national level. The relative poverty rate sharply increased in 2012 in comparison to 2011 (when it equalled 11.1 % among households and 13.6 % among individuals), reaching the highest level since 1997 (Fig. 12.1). Besides 3.2 million households in relative poverty, another 1.4 million (5.6 % of all households) were at risk of poverty: these are defined as “nearly poor” by Istat, in that they are slightly above the relative poverty threshold.
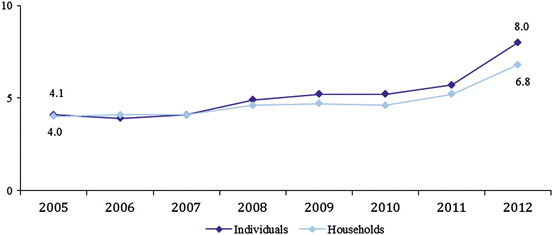
Absolute poverty affected 6.8 % of households (1.7 million households) and 8 % of individuals (4.8 million individuals) in 2012 at the national level. These rates are considerably higher than they were in 2011 (5.2 % among households and 5.7 % among individuals), and represent the highest rates since 2005 (Fig. 12.2).
The worsening in the living standard of Italian families is reflected by the dynamics of relative poverty through time. As noted above, the percentage of relatively poor people substantially augmented in 2012 in comparison with 2011. This increase occurred despite the concurrent reduction in the poverty threshold (down by 20 euro, without taking inflation into account), implying that if the 2012 threshold had been hypothetically “anchored” to its 2011 level – i.e. to the average “standard of living” in the previous year – the relative poverty rate in 2012 would have been higher than that actually estimated.
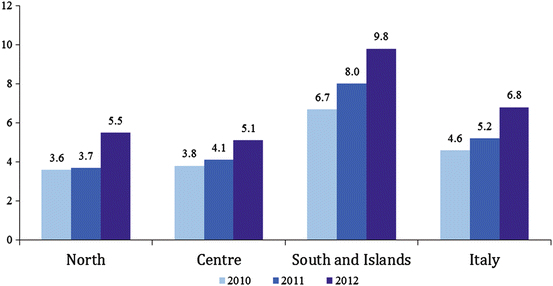
The problem of poverty has been historically rooted in the South more than elsewhere in Italy. Istat estimates show that this trend continued in 2012. The incidence of relatively and absolutely poor households in the South and Islands exhibits much higher values than in the Centre and in the North (Fig. 12.3). This gap is far from being bridged. During the period 2010–2012 the difference in the relative poverty rate among households increased both between southern and northern Italy (from 18.1 to 20 percentage points) and between southern and central Italy (from 16.7 to 19.1 points). Over the same 3-year period the difference in the absolute poverty rate among households also increased both between southern and northern Italy (from 3.1 to 4.3 percentage points) and between southern and central Italy (from 2.9 to 4.7 points).


Fig. 12.3
Relative poverty rate among households in Italy, by geographical area, 2010–2012 (Istat 2013)
The chance of being poor affects migrants to a greater extent than the overall population. For instance, relative poverty affects nearly half (49.1 %) of individuals living in households whose members are all migrant and 43.9 % of individuals living in households with at least one migrant member, in contrast to 17.4 % among individuals living in households without migrant members (Istat et al. 2012).
12.3 Poverty Among Children and Families
Poverty rates are not evenly distributed across social groups. Istat data show that the increase in poverty in 2012 was bigger among households with more minor children. Larger families are more at a disadvantage: the relative poverty rate among households with 3 or more minor children in 2012 was 28.5 % at the national level, 40.2 % in southern Italy. Some social groups are more at risk of poverty. This concerns younger parents: the relative poverty rate among households whose reference person (r.p.) is aged less than 35 equalled 14.7 % in 2012, higher than the rate among households having an older r.p. The chance of being poor is also related to the occupation and professional position of the r.p.: the incidence of relative poverty among households having as r.p. a manual worker (16.9 % in 2012) is significantly higher than the estimated incidence among households having as r.p. a self-employed worker (11.9 %), a manager or a salaried employee (6.5 %), an entrepreneur or a freelance (4.9 %). Among households whose r.p. is unemployed and seeking employment, the relative poverty rate was 35.6 % nationwide, 49.7 % in southern Italy.
Facing difficulties in the job market implies a greater risk of being poor: relative poverty affects nearly half of Italian households whose members are neither employed nor retired following employment. These families – as suggested by Istat – are typically composed of single members aged 65 and over without a work history and people out of the labour market, either couples with children or single parents.
Similarly, absolute poverty particularly affects younger households (8.1 % of households with r.p. aged less than 35 in 2012), larger households with minor children (17.1 % of households with 3 or more children) and households whose members are at a disadvantage in the labour market. Notably, almost one in four (23.6 %) households with r.p. seeking employment were classed as in absolute poverty in 2012, as were nearly one in three (30.8 %) households whose members were not employed nor retired. These values substantially increased in comparison to the previous year (15.5 % and 22.3 %, respectively).
Poverty in Italy particularly affects families with minors (Tables 12.2 and 12.3). One in eight families (12.7 %) were estimated to be relatively poor in 2012. Breaking these figures down by family size, the incidence of relative poverty among households with 5 or more members in Italy was 30.2 % (compared to 28.5 % in 2011), against much lower incidence among households with 4 members (18.1 %), 3 members (15.9 %), 2 members (10.8 %), 1 member (6.8 %). Poverty tends to increase with the presence of minor children: 18.3 % of households with at least 1 minor child were relatively poor in 2012 (in comparison with 12.7 % among all households), increasing from previous year’s value of 15.6 %. Moreover, the incidence of relative poverty tends to increase with the number of minor children living in the household, being equal to 15.7 % among households with 1 minor child, 20.1 % among households with 2 minor children, 28.5 % among households with 3 or more minor children. The situation is particularly negative in southern Italy, where relative poverty affected 33.9 % of households with at least one minor child and 40.2 % of households with 3 or more minor children in 2012.
Table 12.2
Incidence of relative poverty among households, by family type and number of minor children, by geographical area, 2011–2012 (Istat 2013, Poverty in Italy – 2012)
North | Centre | South and Islands | Italy | |||||
|---|---|---|---|---|---|---|---|---|
2011 | 2012 | 2011 | 2012 | 2011 | 2012 | 2011 | 2012 | |
Total | 4.9 | 6.2 | 6.4 | 7.1 | 23.3 | 26.2 | 11.1 | 12.7 |
Family type | ||||||||
Couple with 1 child | 4.8 | 7.4 | 7.3 | 8.2 | 20.5 | 31.3 | 10.4 | 15.4 |
Couple with 2 children | 5.7 | 8.4 | 7.0 | 8.8 | 27.5 | 30.9 | 14.8 | 17.4 |
Couple with 3 or more children | 10.0 | 13.6 | 17.9 | 21.6 | 43.0 | 43.3 | 27.2 | 29.8 |
Families with minor children | ||||||||
With 1 minor child | 5.8 | 7.6 | 8.3 | 7.1 | 26.0 | 32.7 | 13.5 | 15.7 |
With 2 minor children | 7.3 | 10.9 | 8.5 | 12.3 | 30.5 | 34.3 | 16.2 | 20.1 |
With 3 or more minor children | 12.4 | 17.4 | a | a | 50.6 | 40.2 | 27.8 | 28.5 |
With at least 1 minor child | 6.8 | 9.5 | 9.0 | 10.3 | 29.7 | 33.9 | 15.6 | 18.3 |
Table 12.3
Incidence of absolute poverty among households, by family type and number of minor children, Italy, 2011–2012 (Istat 2013)
2011 | 2012 | |
|---|---|---|
Total | 5.2 | 6.8 |
Family type | ||
Couple with 1 child | 4.0 | 5.9 |
Couple with 2 children | 4.9 | 7.8 |
Couple with 3 or more children | 10.4 | 16.2 |
Families with minor children | ||
With 1 minor child | 5.7 | 7.1 |
With 2 minor children | 5.8 | 10.0 |
With 3 or more minor children | 10.9 | 17.1 |
With at least 1 minor child | 6.1 | 8.9 |
Similar trends hold for absolute poverty. While the incidence of absolute poverty was 6.8 % among all households in 2012, it equalled 17.2 % among households with 5 or more members (against 8.3 % among households with 4 members, and lower percentage values as household size decreases), markedly rising in comparison with 12.3 % in the previous year. Absolute poverty affected 8.9 % of households with at least one minor child (in comparison with 6.1 % in 2011) and increased with the number of children: 7.1 % among households with 1 minor child, 10 % among households with 2 minor children, 17.1 % among households with 3 or more minor children.
Income poverty among children and families is related to social exclusion. The presence of dependants, especially minors, is generally associated with higher frequency of economic strain (Barbero Vignola et al. 2013). According to Istat EU-SILC data,3 households with 3 or more children are most likely to incur such difficulties in Italy: 17.9 % of them were severely deprived in 2011, reaching 20 % among households with 3 or more minors. Notably 18.3 % of couples with 3 or more minor children in 2011 reported they could not afford a meal with meat, chicken, fish or vegetarian equivalent every second day, 25.2 % (against 15.4 % in 2010) reported they could not keep the home adequately warm, more than half (53.3 %) reported they could not afford a 1 week annual holiday away from home.
The incidence of poverty and social exclusion is on the rise in all geographical areas in Italy. The situation is however particularly negative in southern Italy, where the percentage of people at risk of poverty or social exclusion4 increased from 42.7 % in 2004 to 46.2 % in 2011. Nationwide the risk of poverty or social exclusion considerably increased especially among couples with 3 or more children – by 5.4 percentage points from 2004 to 2011 – and among single-parent households – by 5.7 percentage points.
As highlighted on the basis of the above data, family composition appears to play an important role. In particular the presence of minors influences the probability of a household suffering from economic strain. By dividing the Italian population into age groups (Table 12.4) it can be noticed that individuals aged 0–18 exhibit on average lower income and consumption expenditure as well as higher poverty levels – particularly in terms of per capita income – than other age groups. Therefore individuals aged 0–18 face higher risk of being poor in economic terms. In 2010 the economic poverty index with respect to per capita income among minors (32.7) was e.g. nearly 9 times as much as that among the elderly over age 65 (3.8).
Table 12.4
Household income, expenditure and poverty indexes, by age group, Italy, 2010 (Bank of Italy 2012)

