Poor for How Long? Chronic Versus Transient Child Poverty in the United States

Fig. 9.1
Distribution of years in poverty for children (n = 2,029)
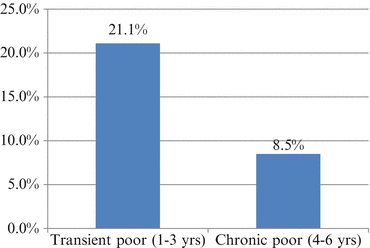
Overall, the proportion of children experiencing chronic poverty (poor in 4–6 years examined) was relatively small at 8.4 %, while the proportion experiencing transient poverty (poor in 1–3 years examined) was substantially larger, at 21.1 % (Fig. 9.2).


Fig. 9.2
Percent of children transient and chronic poor (n = 2,029) (Authors’ analysis of PSID data)
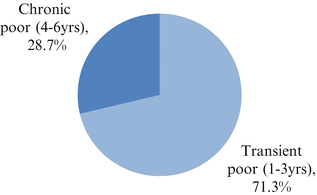
Consequently, chronic poor children represented a relatively small proportion of the overall poor child population. Of the total population of children who experienced any poverty during the study period, 71.3 % were transiently poor while 28.7 % were chronically poor (Fig. 9.3).


Fig. 9.3
Proportion of poor children in chronic versus transient poverty (n = 815) (Authors’ analysis of PSID data)
Several vulnerable demographic groups experienced high rates of both transient and chronic child poverty (Table 9.1). In terms of transient poverty, groups with disproportionately high rates included children in African American, Hispanic, and immigrant households, as well as single mother households. Children in households with a non-working adult had particularly high rates of transient poverty, as did children in households with a disabled adult, and with an adult who was not a high school graduate. Transient poverty rates for these groups ranged from 26.4 to 47.2 %, up to more than double the overall child transient poverty rate of 21.1 %.
Table 9.1
Transient and chronic child poverty rates for different demographic groups (Authors’ analysis of PSID data)
Demographic subgroup of children | Transient poverty rate | (se) [95 % Cl] | Subgroup rate as % of rate for all children | Chronic poverty rate | (se)[95 % Cl] | Subgroup rate as % of rate for all children |
|---|---|---|---|---|---|---|
All childrena (n = 2,029) | 21.1 % | (1.7) | 100 % | 8.4 % | (1.6) | 100 % |
[18.5, 24.1] | [6.0, 11.6] | |||||
African American household head | 40.0 % | (5.4) | 190 % | 23.9 % | (4.8) | 285 % |
[31.3, 49.3] | [16.8, 32.8] | |||||
Hispanic household head | 26.4 % | (4.2) | 125 % | 22.3 % | (5.8) | 265 % |
[19.9, 34.0] | [14.1, 33.4] | |||||
White household head | 16.4 % | (1.7) | 78 % | 2.3 % | (0.7) | 27 % |
[13.8, 19.4] | [1.4, 3.8] | |||||
Other race household head | 14.7 % | (7.3) | 70 % | 0.9 % | (0.7) | 11 % |
[6.2, 31.2] | [0.2, 3.6] | |||||
Immigrant householdb | 28.0 % | (4.4) | 133 % | 17.4 % | (4.7) | 207 % |
[21.3, 36.0] | [10.8, 26.8] | |||||
Single mother householdc | 37.7 % | (4.2) | 179 % | 18.2 % | (4.2) | 217 % |
[31.0, 45.0] | [12.1, 26.4] | |||||
Non-high school graduate head/wife/cohabitor | 33.6 % | (4.8) | 159 % | 26.0 % | (5.0) | 310 % |
[26.0, 42.1] | [18.6, 35.1] | |||||
Disabled head/wife/cohabitord | 37.3 % | (4.4) | 177 % | 15.1 % | (2.8) | 180 % |
[30.3, 44.8] | [11.0, 20.4] | |||||
Working head/wife/cohabitor in all survey years | 16.8 % | (16) | 80 % | 4.1 % | (1.3) | 49 % |
[14.2, 19.7] | [2.4,6.9] | |||||
No working head/wife/cohabitor in 1+ survey years | 47.2 % | (4.6) | 224 % | 34.0 % | (5.1) | 405 % |
[39.7, 54.9] | [26.0, 43.1] | |||||
Full population (children and adults) (n = 12,367) | 16.5 % | (0.76) | 4.5 % | (0.57) | ||
[15.3, 17.8] | [3.6, 5.6] |
Chronic poverty rates were also particularly high for children in households with no working adult (34.0 %) and with an adult who was not a high school graduate (26.0 %). These rates represent three to four times the overall chronic child poverty rate of 8.4 %. Chronic poverty rates were more than double the overall rate as well for children in African American, Hispanic, and immigrant households and in single mother households, and were also high for children in households with a disabled adult. Chronic poverty rates for these groups ranged from 15.1 to 23.9%.
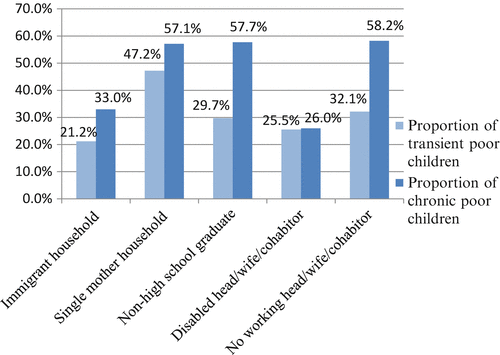
Overall, the demographic groups experiencing high transient poverty rates also experienced higher-than-usual rates of chronic poverty. In fact, in most cases chronic poverty rates for these groups were substantially more disproportionate. As a result, chronic poverty was more concentrated among specific highly impacted demographic subgroups compared to the transient poor population. The transient poverty population also had overrepresentation of vulnerable groups, but by comparison was more similar to the general population (Fig. 9.4).


Fig. 9.4
Proportion of transient poor children and chronic poor children with specific demographic characteristics (Authors’ analysis of PSID data)
Thus immigrants represented approximately one fifth of transient poor children, and one third of chronically poor children. Approximately one third of transient poor children lived with adults who were not high school graduates, and more than half of chronically poor children did so. Similarly, approximately one third of transiently poor children lived in a household with no working adult during at least 1 year of the study timeframe, while for chronically poor children, nearly 60 % lived with no working adult in at least 1 year.
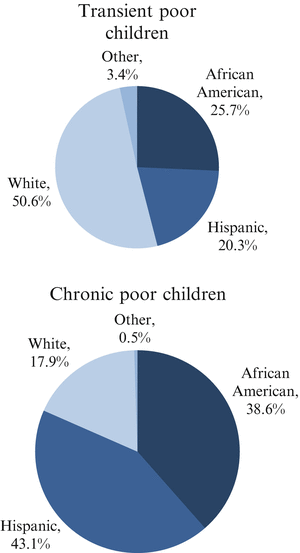
A racial gap was also evident. African American children experienced a transient poverty rate nearly two and a half times the rate of white children, and a chronic poverty rate more than ten times the rate of white children. The pattern was similar for Hispanic children. Thus children of colour represented half of the transient poor, and more than 80 % of the chronic poor (Fig. 9.5).


Fig. 9.5
Racial/ethnic distribution of transient and chronic poor child populations (Authors’ analysis of PSID data)
These results generally parallel the trends in chronic and transient poverty in the United States found in research on the full U.S. population (Sandoval et al. 2009; Rank and Hirschl 1999; Edwards 2014; Anderson 2011; Stevens 1999; Bane and Elwood 1986; Cellini et al. 2008) and in research on poverty persistence in the U.S. population of African American and white children for earlier time periods (Duncan and Rodgers 1988, 1991; Grieger and Wyse 2008; Grieger and Wyse 2013). The high rates of transient and especially chronic poverty among Hispanic and immigrant children are noteworthy, as these populations have not been examined in prior U.S. research on child poverty persistence.
9.4 Impact of Transient Versus Chronic Poverty on Life Outcomes
Chronic and transient child poverty rates are markedly different, but similar vulnerable subgroups within the U.S. population are disproportionately affected by both types of poverty. Children at greatest risk for experiencing either transient or chronic poverty include children of color (African American and Hispanic children and/or immigrant children) as well as children with parents who have not completed secondary education, are not employed, are disabled, and/or are single. These findings are especially troubling given the considerable research evidence pointing to the deleterious effects of poverty on children. Conceptual frameworks from the field of epidemiology provide a useful lens for understanding these poverty impacts, and undergird our understanding of the differential effects of short- and long-term poverty on children’s outcomes.
9.4.1 Epidemiological Framework: The Life Course Approach to Health
Scholars in epidemiology and public health have recently called attention to the need to consider health risks and outcomes from a life course perspective. This approach entails attending to time as a factor in the development of disease and other negative health outcomes over the lifespan, specifically focusing on the duration and timing of exposures that lead to later health problems (Lynch and Davey Smith 2005; Ben-Shlomo and Kuh 2002; Kuh et al. 2003). Many of the documented negative impacts of poverty on life outcomes relate to health, mental health, and development; thus this epidemiological framework is useful for conceptualizing the impact of poverty as an “exposure” that can lead to problematic health and well-being outcomes. There are two primary conceptual life course models in epidemiology, both of which are useful for conceptualizing the impact of chronic and transient poverty.
9.4.1.1 Chronic Poverty as an Accumulation of Risk
The first, the accumulation of risk model, focuses on the duration of exposure. This model proposes that the effects of exposure to negative health influences accumulate over time, with more exposure potentially leading to greater impact on health. In its simplest form, the accumulation of risk may be conceptualized as a “dose-response” model, where a longer duration or greater number of detrimental exposures over time results in more health damage (Lynch and Davey Smith 2005; Kuh et al. 2003).
The accumulation of risk model is particularly useful for conceptualizing the impact of chronic poverty, which can be understood as a long duration of exposure to a negative health influence. Thus the accumulation of risk model suggests that chronic poverty is likely to result in greater damage to health and well-being than transient poverty.