Pharmaceutical Industries, R&D and Public Health in Emerging Economies
11
Pharmaceutical Industries, R&D and Public Health in Emerging Economies
EMERGING COUNTRIES HAVE been extremely successful in expanding their trade and growth, but they have little in common with each other in terms of their IP policies, the state of research and development (R&D) or public health. IP policies are far from being a sufficient framework both for R&D and public health policies, which require their own framework and political will. On the other hand, there seems to be insufficient coordination between IP policies and R&D efforts in some of these countries. In the sense that IP protection purports to encourage long-term R&D efforts and accumulation of R&D infrastructure, there seems to be room for more thought and discussion on how to integrate these two policies. Although available data are not sufficient for describing and analysing the complete situation of R&D and its results in emerging economies, different R&D policies and patenting behaviour of companies in these countries are compared, with a view to understanding the patterns in which patent protection is used.
I GLOBAL PATENT FILINGS BY EMERGING COUNTRIES’ ENTERPRISES
A International and Domestic Patent Filing Patterns
Global patenting makes possible the commercialisation of a wide range of technologies and, today, developing country enterprises are participating in larger technology markets and increasing global competition. In 2004 Morel et al showed the number of patent filings in the US in all fields of technology based on per capita GDP, which demonstrated how important it is for universities, research institutions and companies in developing countries to obtain patents in the US, with its exceptionally large market.1 In 2009, amidst the general decline in international patent filing due to the economic downturn, China became the fifth largest PCT user (chapter 10).2 The differences in the ways companies and institutions in developing countries apply for patents at home and in foreign countries reflect not only their technological competitiveness, but also national industrial policies in the context of a global economy and institutions. Over time patent filing patterns in specific fields of technology can also show trends in the scientific and technological policies of different countries. Patenting patterns of companies from different emerging economies reflect the different industrial and R&D policies of each country.
The following Section explores the global strategies of developing country patent applicants in the fields of pharmaceuticals and biotech medicines. The International Patent Classification (IPC)3 classifications A61K and C12N are used as proxies for counting the number of medicinal inventions and the number of biotechnological medicines or therapies, respectively, in the following codes for countries and regions: AR (Argentina); ARIPO (African Regional Intellectual Property Organisation, an intellectual property organisation consisting of 15 English-speaking countries in Africa); BR (Brazil); CN (China); CU (Cuba); IN (India); MX (Mexico); OAPI (African Intellectual Property Organisation);4 ZA (Republic of South Africa); US (United States); EPO (European Patent Office); WO (World Intellectual Property Organisation); PCT (Patent Cooperation Treaty); and JP (Japan). The ‘nationality’ of the applicant can pose problems. There is no international rule concerning the nationality of patent applicants and their applications may provide information based on different notions of nationality. For example, the word ‘Brazilian’ referred to in the patent application could refer to a local Brazilian company or a Brazilian subsidiary of a multinational corporation. In many patent databases, the nationality of the applicant is not shown. In WO PCT publications, for example, Japanese nationality is attributed to Pfizer Japan Inc (Pfizer’s Japanese subsidiary) even though the nationality of Pfizer Japan is perceived by many to be American. In Japan, the patent office does not attribute any nationality to companies.
Originally, a survey on A61K pharmaceutical patent filings at different patent offices was carried out by Momsen, Leonardos and Cia in Brazil in 2003.5 Their data on nationality were based on the names of applicants and listed only the companies in the relevant developing countries to the exclusion of multinational corporations. In the following study, by contrast, a proxy of nationality is used. The number of applications under A61K and C12N, for which the applicant claimed the right of priority for country X, was considered to be the number of applications from country X. To identify published patent applications6 submitted by enterprises operating in developing country X in their home country and in foreign patent offices, such as the US Patent and Trademark Office (USPTO), the European Patent Office (EPO), the Japan Patent Office (JPO) and the WO, the advanced search function of the EPO database (esp@cenet)7 is used. For most countries, at least until 1998 (the year India joined the Paris Convention and the PCT), there was very little difference between these two methods of identifying the nationality of the applicants.
Another methodological problem is that there are increasing differences in the number of applications published recently by developing countries with figures appearing in different databases. Among different data bases, a large numerical gap is evident especially, since 1998, in the case of India. The number of applications filed by Indian nationals in India since 2000 (through PCT or the Paris route) is far greater in the case of the Dialog DWPI database than on Espacenet. This would suggest that a considerable number of Indian patent applications abroad were not based on priority application in India, and probably not in the US, either. The data, based on priority country, therefore, seem to be imperfect for India. However, they do reflect the overall tendency of Indian companies to rapidly increase their patenting activities abroad. For applicants from other countries, this problem does not occur and there is little discrepancy in the application numbers obtained through different data bases.
B Diversity of Filing Patterns among Companies in Developing Countries
Brazil’s A61K patent filings in Brazil increased in the late 1990s, but decreased subsequently. There has been no significant increase in PCT applications. It seems that Brazilian applicants have little interest in markets outside Brazil.
Table 11.3: Brazil’s Pharmaceutical (A61K) Patent Filing Publications
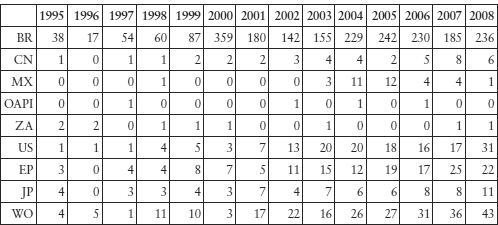
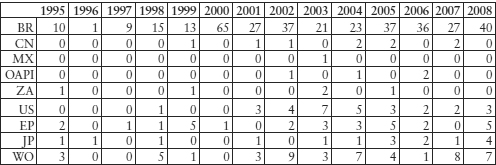
Table 11.4: Brazilian Companies’ Biotechnology (C12N) Patent Filing Publications
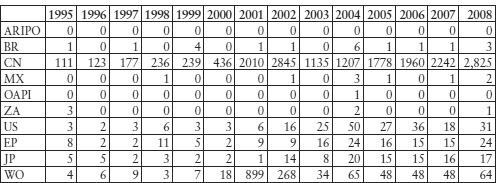
There has been an increase in the number of A61K applications filed in the US by Indian companies since 1998. The rapid increase also in the number of WO applications is due to the fact that India took part in PCT that year. Since then, according to the Dialog DWPI database, there have been more applications made by companies with Indian nationality than are shown in the tables below. Patents filed by Indian companies in foreign countries were for inventions concerning the processes for manufacturing admixtures (formulations, combinations) or derivatives forms (eg polymorphs, isomers thereof) of medicines.
Table 11.5: Indian Companies’ Pharmaceutical (A61K) Patent Filing Publications
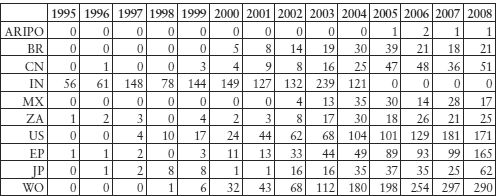
Indian patent filings for biotechnology inventions are steadily increasing, although the absolute number is not high. In comparison to the recent past when plant-based research was predominant, there seems to be more research on relatively advanced biotechnology, such as methods of preparation of human embryonic stem cells or the use thereof, for example. However, for these inventions, the priority right is not claimed in India but in the US or WO. Increased vaccine research is also reflected in these data.
The State Intellectual Property Office of the People’s Republic of China (SIPO) granted many patents to domestic applicants. The number of pharmaceutically related patent filings, particularly of patent classification A61K8 which includes pharmaceutical ingredients, is voluminous, of which 30 per cent are traditional Chinese medicines (TCM).9 Ninety per cent of patent filings for TCM are made by domestic companies and, between 1985 and 2000, these amounted to approximately 20,000 filings. Most of them are combinations and not really backed by scientific research. Approximately 50 per cent of Western medicine filings are made by foreign companies.
Table 11.6: Domestic and Foreign Applications for A61K Patents
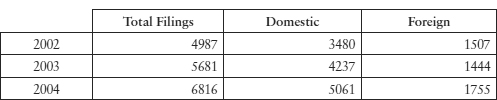
Source: SIPO. In 2002, of 4987 filings, 1520 applications were related to traditional medicines, 1447 to organic chemical and medicinal preparations, new usages of medicines and cosmetics, 606 to biological preparations and 1414 in other sub-classes under A61K.10 The SIPO statistics use A61K based on the International Patent Classification (IPC),11 although national classifications can differ slightly from each other.
Table 11.7: Chinese Companies’ Biotech (C12N) Patent Application Filing Publications
Although Cuba is not an ‘emerging’ or market economy, the country’s biotech medicines development policy and its use of the global patent systems for technology trade (licensing) may be of interest to other developing countries.
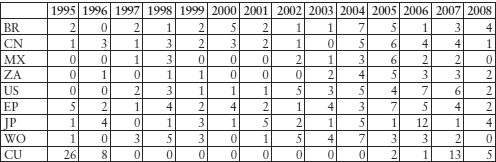
Cuban companies are filing applications in advanced industrialised and developing countries for patents for bio-pharmaceutical substances. On the espace@net data base, as of 20 June 2010, there are in Cuba 115 publications of patents filings which refer to C12N and 294 to A61K from residents of different countries. The number of applications in the US from Cuban residents is increasing (43 for C12N and 115 for A61K).13 As Table 11.8 shows, Cuban residents rarely file patents in Cuba (in total, 122 A61K and 82 C12N filing publications on the espace@net data base), but use patent protection systems overseas. Few foreign companies file for patents in Cuba, although there are filings of more than three US-based entities (universities/companies) according to the Espace@net database.
Table 11.8: Cuban Companies’ Biotech (C12N) Patent Application Filing Publications
It was Cuba’s determination and quest for self-sufficiency in food and medicinal supplies in the US embargo situation that led to a policy of selectively promoting biological scientists and engineers.14 Medicuba, an organisation that handles pharmaceutical production, as well as imports and exports of medical equipment and products, was established in 1972 and began the production of bio-similar products approved elsewhere.15 After local outbreaks of meningitis, dengue fever and conjunctivitis in the 1980s, the Cuban Government set up various scientific institutes specialised in biotechnology.16 The CIGB was established in 198617 and, by 1991, 53 such scientific, manufacturing and commercial entities were organised under the Health and Agriculture Ministries. Heber Biotec SA is one of the ‘spin-off’ commercial arms, and owns the exclusive rights for commercialisation of the technologies developed by the CIGB and seven other biotech institutions.18 Biomedical research, clinical studies, drug production and commercialisation abroad were integrated into a ‘closed cycle’ strategy.19
Since the launch of recombinant streptokinase in 1993, the focus was placed on the production of innovative biogenerics. In 1993, Cuba produced 1150 vaccines and medicines (vaccines against meningitis B, etc), diagnostic test drugs and 132 generic medicines, and they exported products amounting to US$1 billion.20 Currently, 40 per cent of Cuba’s active pharmaceutical ingredients are imported from China, and the ratio of domestic production is also relatively high.
Most patented products developed in Cuba are biosimilars with some incremental innovation: haemophilus influenza type B synthetic vaccine, recombinant vaccine for hepatitis-B, thrombolytic recombinant streptokinase, granulocyte, colony-stimulating factor and alpha and gamma interferons, all came to be patented and licensed internationally.21
In 2004, three cancer vaccines developed by the Cuban Centre of Molecular Immunology (CMI) were licensed through a Canadian company to a US bioventure company, CancerVax. Indian biotech companies have been swift in associating with these projects. For example, Panacea created a joint venture in 2002 with Heber Biotec to develop a vaccine for hepatitis-B and Biocon conducted phase II trials of a monoclonal antibody cancer drug developed by CIMAB, one of Cuba’s cancer drug research institutes, marketing the product (BIOMab-EGFR (rhMAb)) in 2008 under a licensing agreement.
Most of these products may not be brand new molecular entities (NME), first in class, or innovator drugs, but considerable technological improvements seem to be added. For example, IFN-gamma enveloped in plasmids (IL-2) seems to have relatively high scientific and technological quality. The patent for the invention entitled ‘method for enhancing healing of diabetic foot ulcers by injecting epidermal growth factor22‘was registered in the US on 16 December 2008 (US 7465,704 also WO 03/053458, etc). It is certainly a limited, new use invention of a known substance, but the idea of directly injecting EGF for the treatment of diabetic foot ulcers seems to have been evaluated highly by the USPTO and other developed country patent offices. An oncology company in Canada, YM BioSciences Inc, commercialises nimotuzumab, a humanised monoclonal antibody that targets the EGFR with an improved side-effect profile compared to other marketed EGFR-targeting products.
Cuban biotechnology research seems to be directed towards developing medicines for treatment of diseases with a high death rate, both in Cuba and elsewhere in developed countries: heart disease, malignant neoplasm, vascular disease, pneumonia and influenza.23 The country has adopted the International Conference on Harmonisation of Technical Requirements for Registration of Pharmaceuticals for Human Use (ICH)24 standards. This allows Cuban medicinal products to be used directly for the application for market authorisation in developed countries.
Heber Biotec SA and Cuban research and manufacturing institutions carry out extensive commercial operations in the world. For example, the applicant of the patent WO 2004.094477, ‘recombinant antibodies and fragments recognising ganglioside N-clycolyl-GM3 and use thereof in the diagnosis and treatment of tumours’, is the Centro de Immunologia Molecular (CIM).25 This application was made through the PCT not only for the US, Europe and Japan, but also for such countries as Botswana, Belize, Ghana and Gambia. The export markets for Cuban products include developed countries and Latin American countries such as Argentina, Brazil, Colombia and Mexico.26
II PHARMACEUTICAL INDUSTRY AND R&D POLICIES
These global patterns of patenting by companies of emerging economies reflect their countries’ policies, industrial structure and realities relating to R&D. Efforts for long-term pharmaceutical and biotechnology R&D have begun in some of the rapidly growing countries. The scale of investment and policies for encouraging innovation differ considerably across these countries.
A India’s Industrial and Commercial Success
The major Indian pharmaceutical companies have been highly successful in venturing into developed country markets since the late 1990s. This contrasted with the past, when they exported and distributed their products mostly in the Soviet Union, Eastern Europe and developing countries.27 Around 2001, Indian generic companies applied to have approval for 40 medicines (mostly formulation drugs) through the US FDA Abbreviated New Drug Application (ANDA)28 procedures under the Drug Price Competition and Patent Term Restoration Act (Hatch-Waxman Act 1984). In 2007, companies from India received 132 ANDA approvals, while US companies received 169.29 The number of Drug Master Files (DMF – information related to drug production) submitted in advance by Indian companies to the FDA with respect to active pharmaceutical ingredients (APIs) also increased. According to Chaudhuri, these companies with DMFs and/or ANDAs in the USA exported drugs worth Rs 206,552.3 million, which constituted about 70 per cent of India’s total drugs exports in 2007–08. India is the largest filer of DMFs, with 274 compared to only 90 from China.30
By 2007, India ranked third in terms of volume (8 per cent)31 and 14th in value in the global pharmaceutical market.32 Recent export growth has reached nearly 30 per cent per year, and exports have become the major source of income for the three major Indian generic companies: Ranbaxy, Cipla, and Dr Reddy’s.33 The main export markets for finished pharmaceutical products from India are Russia, South-East Asia, Africa, Latin America, China and Hong Kong. However, bulk exports of active pharmaceutical ingredients from India, which account for more than 50 per cent of the international trade in bulk drugs, are sent all over the world, including to Europe and the US.34 Indian drugs cost about one-tenth of the international price, their production costs are one-fifth, and R&D costs are one-eighth of those in developed countries.35 The Report of the Task Force, Ministry of Commerce & Industry of India, in 2008, summarised India’s global trade role as follows and promoted measures to further its export:
India with its significant advantage of low cost of innovation, low capital requirements and lower costs in running facilities, well established manufacturing processes, R&D infrastructure, is strategically well positioned to emerge as “Health Keeper” of the world.36
Table 11.1 shows the dramatic increase of Indian products in the US market. This may be explained by the rapid increase of active pharmaceutical ingredients and the most profitable exports of generics, where generic exporters successfully challenged US patents, obtaining six-month exclusivity granted to the first generic to enter the market under the ANDA Paragraph IV system. The relative decline from 2007 to 2008 of Indian exports to the US may have been a reflection of the relative decline of the success rate of Indian companies in Paragraph IV litigations there. Notably, the value share of Indian pharmaceutical exports in the world total was only 1.5 per cent in 2000, 2.0 per cent in 2007 and 2.2 per cent in 2008.37 The relatively low value-added transactions show that exporting innovative drugs with new technological components would have brought much more revenue to Indian companies. This, however, does not seem to be among the current policy objective of the Indian government.
Table 11.1: India’s Exports and Imports of Pharmaceutical Products (HS-30),38 2000–08
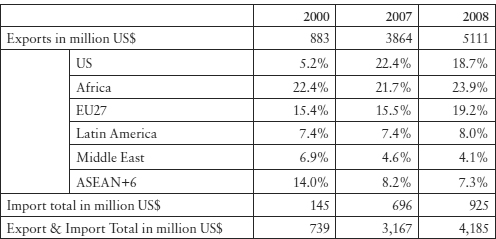
Source: K Shiino, ‘Basic Knowledge of India’s Economy’ (2009) JETRO 99.
B Emerging Economies’ R&D Infrastruture
In the late 1990s, several of the major Indian pharmaceutical companies considerably increased their investments in R&D. Member companies of the Indian Pharmaceutical Alliance (IPA)44increased by 15 times their R&D expenditure between 1995 and 2006.45 Moreover, through alliances with multinationals, and by acquiring European and US companies, these Indian companies appeared to be attempting to partially transform themselves into R&D companies. The top 10 companies hold a 30 per cent share of the Indian market and among these, companies such as Dr Reddy’s, Ranbaxy, and Piramal began by investing as much as 8 per cent of their sales into R&D.46 To ensure that R&D does not put stress on their generic drug divisions, these companies were taking measures such as establishing finance companies. The development of India’s biotechnology companies through venture capital and alliances with multinationals was also prominent.47
Apparently, the company size, in terms of either capital or personnel numbers, is not yet sufficient to make independent R&D sustainable, even though the costs required to develop pharmaceuticals in India are extremely low in comparison with Europe and the US. Some major Indian companies are also orienting themselves towards the development of global drugs through mergers, although it will be difficult for them to conduct clinical trials with Indian capital alone. On the domestic market, on the other hand, the lack of pharmaco-vigilance may be caused by insufficient staffing and experience at the state level.48
Industrial R&D expenditure generally has increased in India over the 10 years between 1995 and 2006. The R&D expenditure of leading industry groups is the highest in the pharmaceutical sector. During 2002–03, the industrial sector R&D spending was the highest in drugs & pharmaceuticals, accounting for 28.7 per cent, followed by transportation and chemicals (other than fertilisers) at 21.3 per cent and 7.6 per cent respectively.49 In India, public expenditure on industrial R&D is spent mostly in the defence sector (41.9 per cent), followed by fuels (22.1 per cent) and electronics equipment and electricals (14.2 per cent).50 This shows that the public industrial sector investment in new frontiers of technology such as biotechnology has not yet been significant. Moreover, during 2000–02, India’s public and private spending on R&D per capita was US$3.53, much less than that in China ($12.15), Brazil ($22.55) and far less than that in the US (US$962.15), Japan ($976.58) and Sweden ($1104.20). These statistics are not really comparable unless they are adjusted by purchasing power parity (PPP). However, these figures give a rough idea about the priority given to public R&D policy by each government. The developing countries whose per capita GDP was between US$1000 and US$10,000 spent more than US$20 per capita R&D, with the exception of Argentina ($11.03), Egypt ($2.20), Thailand ($5.01) and Venezuela ($14.48). Public R&D spending in Pakistan was $1.13 and that of Sri Lanka, $1.46. Although emerging economies with large populations may face difficulties in increasing public R&D expenditure, it is striking that the per capita public industrial R&D expenditure of some middle-income countries was close to that of LDCs (Nepal $1.50) and that there was a huge gap of R&D expenditure between developed countries and middle-income developing countries.51 This is significant because middle-income developing countries, with their relatively high technological capacities, could have contributed more to global innovative efforts.
During 2002–03, there were 115,936 researchers in India, whereas the figure for China was 805,171 (other figures were 1,239,910 for the US and 645,795 for Japan).52 The number of researchers per 1 million habitants in India was 110, whereas this figure was 7431 for Finland, 5171 for Sweden and 5085 for Japan.53
The scale of R&D in emerging economies was generally increasing. The percentage share of developing countries in the total R&D expenditure showed an increasing upward trend during 2000–02. Among the developing countries, Brazil and China spent 1.04 per cent and 1.23 per cent of GDP on their R&D, respectively, while India spent 0.80 per cent of its GDP on R&D. India’s R&D share of its GDP has remained stable at the rate of 0.7–0.9 per cent since the early 1990s. For developed countries, on average, the figure is 2.3 per cent (Japan 3.11 per cent, US 2.67 per cent).54
The above statistics suggest that national (public) infrastructure and long-term perspectives for innovative R&D in frontier technologies may be slower to develop in India than in China, for example, where the national educational infrastructure is solidly expanding. General statistics also suggest that pharmaceuticals and biotechnology in India could at best follow its most successful pioneer field, which is information technology (IT). India is the largest exporter of computer information services in the world (22.5 per cent),55 but its overall IT industrial competitiveness has been reported as not being as proportionately high. For example, the Economist Intelligence Unit has undertaken studies based on their benchmarks, detailing the conditions of: (1) the overall business environment, (2) infrastructure, (3) human capital, (4) the legal environment, (5) the R&D environment, and (6) support for industry development.56 According to these reports, India ranked 48th in the world in 2008 and 44th in 2009, whereas China moved from 50th to 39th. India is strong in improving the cost of applied manufacturing programmes, notably customised software. However, the basic inventions tend to move from the US to India.
In the years around 2000, there was a high expectation both in India and around the world that Indian pharmaceutical companies would rapidly turn into research-based enterpreises (see chapter 10 p 364). By 2001, Dr Reddy’s had nine molecules in the pipeline, one of which was licensed out to Novo Nordisk. Ranbaxy had eight, one of which was licensed to Schwarz Pharma (Germany). There was a considerable number of molecules at the preclinical stage, and all of them concerned ‘incremental innovation’, notably new modes of administration, new uses of known compounds or derivatives thereof.57 Some 30 molecules were clinically promising and many of them were licensed to Western multinationals. However, R&D situations in 2004 looked less brilliant. Few drug candidates were at clinical trials. The Novo Nordisk and Schwarz licences failed in clinical trials. Torrent had licensed one molecule to Novartis but the contract was terminated in 2005.58 It is reported that Piramal Healthcare has four (two anti-cancer and two diabetes), Cadila Healthcare, five, and Lupin, four (two anti-psoriasis, one TB, one migraine). Dr Reddy’s has two (one diabetes and one anti-cancer) and is working on a host of programmes. Glenmark has five molecules (diabetes, osteoarthritis, asthma, neuropathic pain, rhueumatoid arthritis).59 One of these molecules, oglemilast, for asthma, which was licensed to Forest Labs (US) at Phase II (asthma), failed in clinical trials in 2010.60
In January 2010, Businessworld published a table entitled ‘Where Have the Molecules Gone?’61 As reasons for their disappearance, the magazine cites lack of focus and strategy in research; lack of talent (few scientists have experience in new drug development); and the fact that US drug regulator FDA is clearing fewer drugs than before. According to this magazine, ‘not all of those in the running to discover a new drug have lost hope yet. But the wild optimism has died out.’62
DG Shah asserts that ‘India needs more time for creating medicines of Indian origin’.63 Certainly; it took 20 years for Japanese companies to become research-based. The total number of molecules in the pipeline in India seems to be less than that of a single R&D-based company in developed countries, and there are no miracles in the scientific world. Chaudhuri explains the main type of research that is being undertaken in India today:
Even at the pre-clinical stage, Indian companies are not engaged with all the R&D involved. Indian companies are not involved in basic research of target identification for new drugs. They rely on the basic research of others and adopt an approach called ‘analogue research’. This entails working on certain pre-identified targets for specific diseases to develop molecules that alter the target’s mechanism in the diseased person.64
An explanation given by many former Indian officials and pharmaceutical industry people, is that India is committed to innovation that is ‘genuine’,65 not ‘incremental’, which is the purpose of instituting section 3(d) of the Indian Patents (Amendment) Act 2005. In order to support drug R&D, the Department of Pharmaceuticals in the Ministry of Chemicals and Petrochemicals is planning to set up a fund of US$430.5 million to help R&D, ‘with the vision to make India one of the top five global pharmaceutical innovation hubs by 2020’.66