Patterns of International Ocean Trade
Chapter 3
Patterns of International Ocean Trade
Douglas K. Fleming*
1. Introduction
In 2007, before the impacts of a global economic recession had been fully realised, nearly 7.5 billion metric tonnes of goods were shipped in commercial oceanborne trade. The ocean transport task for this movement translated to more than 31 trillion tonne-miles.1 Roughly 59% of the total cargo volume moved in bulk. These impressive dimensions of world seaborne trade leave unrecorded a huge amount of empty space and deadweight lifting capacity of merchant ships steaming in ballast towards their next loading range or leaving their loading range only partly full of revenue cargo. Empty cargo space, like empty seats on passenger airplanes, reflects something lost forever, while vessel operating costs continue inexorably. This lost potential, to an extent inevitable because of basic global patterns and geographic separation of commodity production and commodity consumption, will be a recurring theme in this chapter.
The opening section of this study contains a few reflections on centuries-old trading patterns for ships under sail. Today’s bulk commodity trades, which generate many millions of miles of ballast steaming, each year will then be examined. Possibilities for combining different bulk trades in some sort of logical geographic sequence will be considered. The general cargo trades, with particular focus on container line service, will be investigated. The directional imbalances of cargo flow on the main liner routes will be noted and possible network adjustments and service scenarios to cope with the empty space problem will be presented for consideration. Finally, prospects for the twenty-first century will be briefly outlined.
2. Early Patterns Under Sail
Thirty years ago A.D. Couper’s “The Geography of Sea Transport” appeared on the bookshelves of students interested in ocean trade and transport (Couper, 1972). Professor Couper, master mariner, geographer and head of the Department of Maritime Studies at the University of Wales Institute of Science and Technology (UWIST), was an expert on ocean trade patterns. In his book there is a thought-provoking map entitled “World Wind Systems (January) and ocean routes of European sailing vessels”. It is drawn to a cylindrical projection, stretching apart meridians of longitude, as does Mercator’s projection. It covers a “world and a quarter” so that the Pacific, Atlantic and Indian Oceans can be seen in uninterrupted form. On it are depicted, with sweeping arrows, the major wind systems encountered at sea in January, and five historic trade routes in the sailing ship era – the Guinea trade triangle, the Dutch East India Co route between Amsterdam and the East Indies, the clipper ship route between Europe and Australia, the transatlantic Anglo-American colonial route and the transpacific Acapulco-Manila Spanish galleon route.2
The correlation between the favouring winds and the chosen tracks for the trading vessels stands out clearly on Couper’s map. One knows that the chosen tracks shift seasonally as the prevailing winds shift. By summertime, for example, southwest monsoons replace northeast monsoons in the Indian Ocean.
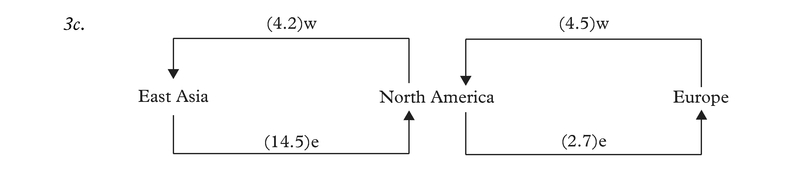
Basically this is a pre-industrialisation, pre-liner service picture. To it one might add many other Portuguese, Spanish, French, Dutch and British “imperial routes” connecting mother countries with their colonies. And many of the routes were controlled by state-franchised trading companies. To be sure, most of these old transoceanic paths of commerce have been displayed in historical atlases,3 usually in the form of simple lines curving around continents and across oceans, joining points of origin and points of destination with no attention to precise tracks, much less to seasonal variations in ocean tracks. Couper’s map suggests much more. Removing his Guinea trade triangle and simplifying his winds to include only the voyage-speeding westerlies and the trades, we have the graphic image reflected in Figure 1. One might add to this image the patterns of favouring ocean currents which all mariners seek.
These old trading patterns were “round voyages”, with outbound and homeward legs of the voyage quite often following very different paths, not only because of prevailing winds, ocean currents and weather but also, in the case of the Anglo-American colonial route, to pick up and deposit cargo en route, e.g. in the Caribbean and heading north along the American east coast. Generally, two-way cargo flows were available on the Spanish-controlled Acapulco-Manila route, the Dutch-controlled East Indies route and, later on, the British-controlled Australian route. However, in cargo volume terms, there could be large directional imbalances and seasonal variations. The ships engaged in these trades were, by modern standards, very small and often the cargoes were valuable goods – silver, gold, silks, spices, for instance – that took up little cargo space but generated high freight revenues when rates were ad valorem-based. And the “organised” nature of the trade routes mentioned above, since they were controlled by the imperial state or by a powerful state-franchised trading company, meant that the ships serving the trades had fair assurance of onward or homeward cargoes. Empty space on long ballast voyages was not the important consideration it was to become in the late nineteenth and twentieth centuries. It should be noted that these were, by modern definition, at least, tramp trades, however well organised, served by relatively small, multi-purpose sailing vessels adaptable to various cargo types, not excluding human cargoes, slaves or emigrants.
Unfortunately the mercantilist philosophy that was fashionable in Europe in the seventeenth, eighteenth and part of the nineteenth centuries led to highly protected trades in which mother countries paired off with their own colonies, enacted navigation laws which favoured ships of their own flag and often used high tariffs against imports from rival empires. Merchant fleets were really armed merchant navies, commanded to serve the state. When one views these mercantilist systems in global perspective, it is clear that they led to geographically inefficient networks in the form of many shuttle
services within imperial frames and relatively little “cross-trading” that could have reduced the amount of empty cargo space sailing unproductively across the oceans. Ironically these shuttle service patterns between imperial home ports and distant overseas colonies were somewhat analogous to the much more recent UNCTAD 40–40–20 scheme for splitting cargo allotments and ocean transport privileges 40–40 between trade partners (e.g. a developed and a developing nation) and leaving only 20% for “cross-traders”. Of course the political, social and general economic motivations for the two sets of shuttle service patterns were vastly different. Yet the fact remains that the general back-and-forth route configurations were quite alike and there was a consequent accentuation of the empty cargo space problem when there were striking differences in the volumes of cargo flowing in either direction, as there almost always were.
Figure 1 reveals the remarkable clipper ship route in the Australian trade in the 1850s, outbound from Britain via Cape of Good Hope and homeward via Cape Horn. From a point in the South Atlantic, usually closer to South America than Africa, these very fast, fine-lined sailing ships swooped south of Cape of Good Hope into the “roaring forties” zone of westerlies and along a looping approximation of the great circle route to the southern coast of Australia. Homeward bound in an easterly direction, the ships again dipped far into the Southern Ocean, again with following westerly winds, and again approximating a great circle track past Cape Horn. These were ships, both American and British-owned, at the dawn of the free trade era in the 1850s, that took maximum advantage of the winds, currents, navigational aids of the time, and the cargo potentials, to turn profits for their owners.
3. British Impact on Ocean Trading Networks
As the world’s front-runner in massive industrialisation, Britain by the mid-nineteenth century seemed to have the world of commerce by its tail. Having abandoned the mercantilist doctrines of the past for the principles and practices of free trade, Britain was a leader in seaborne trade, building what became the world’s largest steam-powered merchant fleet and the world’s most highly developed banking, chartering, insuring, shipping and other trade related services concentrated in the old City of London.
The curious thing about Britain’s spectacular and, to some extent, unilateral movement toward freer trade was that it took place in the imperial frame, in an empire that spread over the globe. Perhaps it made practical sense to be a free-trading imperialist when you led the world in the production of goods and services. Not to say that Britain traded only within the imperial frame, but the latter certainly had an impact on the networks of ocean trade that were handed down from the sailing ship era, reinforcing the radial patterns emanating from home base. If one added the radial patterns of the French and other European powers to the British hub and spoke pattern and put the whole in global perspective it gave a pronounced Eurocentric impression of world commerce in the latter part of the nineteenth century. And it was not really a false impression. Western Europe was the hub of world commerce. However, this set of Europe-based radial networks did not necessarily reflect the most efficient transportation system. Network analysts in the modern era have noted that pure hub and spoke networks have minimal connectivity. There is only one path from any one spoke end to any other and that is via the hub.
A.J. Sargent, British commercial geographer, recognised this network connectivity problem long ago in his unusually perceptive study, Seaways of the Empire. From early twentieth century data he traced movements of British shipping in South African, Indian, Australian and other commonwealth trades, finding that ships “disappeared” from one trade and “reappeared” in another. In between was a “hidden” ballast-voyage or half-empty intermediate voyages moving ships to other trade routes. Of course this is common tramp shipping behaviour and not infrequent liner behaviour, and it shows that British steamship lines before World War I had ways of coping with the radial networks and directional imbalances of trade volumes on specific routes. It reminds us, too, that, for British shipowners then, and most shipowners today, “ocean lines are not worked for purposes of philanthropy but to pay dividends” (Sargent, 1930, p. 15).
Although we may have heard more about their spectacular passenger liners, the British merchant fleet in the two decades prior to World War I contained a large number of multi-purpose freighters in the 7,000 to 8,000 deadweight tonnage range. These could be used either in tramp or liner service. Quite often there would be outbound cargoes of coal from Britain to coaling stations around the globe and return cargoes of the various products of the colonies or other overseas areas the British lines were willing to and allowed to serve. The versatility of most of these vessels was an important attribute, enabling the steamship lines to adjust to directional imbalances on trade routes, ballast to other trades, if necessary, and, in general, minimise the empty cargo space problem by reducing the amount of non-paying ballast steaming.
The British coal-burners were the forerunners of the thousands of oil-burning “10,000 tonners”, the American Liberty, Victory, and C2 types built during World War II. These vessels had the built-in flexibility and adaptability for the carriage of various bulk and break-bulk cargoes in various trades. The prototype of the slow but amazingly serviceable American Liberty ship was, by the way, British-designed. Sixty of them were contracted to be built in American yards for the British early in World War II (Gibson and Donovan, 2000, p. 166). The thousands of Liberty-size vessels built between 1942 and 1945 became an essential component in Allied wartime convoys and supply chains.
In retrospect, the British, controlling a large portion of the world’s pre-World War I merchant fleet, had a remarkable impact on the patterns of nineteenth and early twentieth century ocean shipping. Americans must concede, also, that it was the British who selected New York as the main distribution point for goods that had accumulated during the War of 1812 awaiting entry into the American market. This gave New York’s port its great leap forward (Albion, 1939, chap. 1). It was a small group of expatriate British textile merchants, originally from Yorkshire, who formed Black Ball Line to provide the very first transatlantic liner service between New York and Liverpool. Black Ball booked baled cotton diverted to New York from southern US ports for their eastbound transatlantic voyages and then lined up Yorkshire and Lancashire textile goods for their westbound voyages (Albion, 1939, pp. 99–100). It was the British, again, who propelled world shipping into the use of iron-hulled, propeller-driven steamships. And it was Britain that gave the world the theories and, especially from 1850 to 1875, the practices of free international trade (Ellsworth, 1958, chap. 4).
4. Bulk Commodity Trades: 2007
A.J. Sargent remarked, long ago: “The ultimate determining element in the employment of shipping lies in the sum of the geographical conditions of each region in relation to those of other regions of the world, though the effect of such conditions may be modified greatly by economic or political policy on the part of individuals or Governments.” (Sargent, 1931, p. 25). Sargent’s comment pertained to any seaborne commodity trade. It certainly would apply to bulk commodity shipping today, perhaps with the insertion of “or corporations” between “individuals” and “Governments”.
The tonnage imbalances between exports and imports for regions of the world and for individual ports are most striking in the bulk commodity trades. Very seldom are there two way cargo flows between regions for the bulk movement of oil, coal, iron ore or grain, even though these four broad commodity categories contain different sub-types and grades. However, there are two-way movements of the ships that carry these materials. One way they are laden with cargo. The other way they are ballasting, very often returning to the original loading range, signifying that half the voyage steaming is in ballast, a regrettable but seemingly inevitable waste of cargo space. This, of course, reflects the basic commercial geographic reality that raw material supply sources and the markets for these materials are often separated by large transoceanic mileages. It also suggests that both shippers and carriers have been somewhat resigned to shuttle service itineraries.
Over the past half century the rise of proprietary carrier fleets – oil companies owning, or controlling by long-term charters, fleets of tankers; steel making companies controlling dry bulk carrier fleets for the movement of their inputs of coking coal, iron ores, etc. – seems to accentuate the long ballast voyage problem. The ships engaged in these proprietary carrier trades are often very large and specially built for the carriage of one commodity type. There is a built-in inflexibility when such vessels are employed. Their operations may be confined to a back-and-forth shuttle service. The primary purpose of the fleet is to serve the transport needs of the corporation; therefore the emphasis has been on transport timing, cost, and reliability, in other words on the production function. The focus, understandably, is not on revenues from shipping since shipping is viewed by the firm as an “in house” and “at cost” service. Unless the normal intra-firm movements of materials are in some way disrupted, the proprietary carrier fleet is not inclined to move from one trade route to another. It stays in the trade for which it was designed and built, or for which it was chartered.
The independent tramp operator of the past and a dwindling number of owners of multi-purpose or combined carrier fleets, today, might be inclined to move from one trade route to another, seeking efficient geographic patterns that maximise their rate of utilisation on paying cargo and minimise ballast steaming.4 Whether this results in profit, assuming profits are desirable, depends also, of course, on the revenue side of the equation.
4.1 Market locations
In the last half of the twentieth century many scholars in a variety of social sciences became enamoured with concepts of “cores and peripheries”. Geographers struggled to define, in precise and mappable terms, the core industrial regions of the world. The unevenness of industrial development in the spatial sense makes this difficult. Very often the available statistical data pertained to the nation, not to the regions within it. And, as one famous historian observed, “All advanced economies have their ‘black holes’”, their local pockets of backwardness (Braudel, 1984, p. 42). Economists identified the processes and stages of economic growth, the leading sectors in specific countries, the industrial concentrations and industrial linkages. They even assigned time frames to the stages of growth (Rostow, 1962, chap.13) but they were not particularly concerned with the precise geographic dimensions. However, scholars in the field of regional science (e.g. August Losch, Edgar Hoover, Walter Isard) have recognised some of the intra-national changes in industrial location which continually re-shape cores and peripheries.
It is well supported statistically that the world’s most massive industrial developments over the past two-and-a-half centuries took place in Western Europe, eastern North America and eastern Asia, setting a pattern that profoundly shaped ocean trade flows. The early industrial cores experienced rapid growth of the manufacturing sector, originally fuelled by coal and given great economic momentum by ferrous metallurgy and metalusing industries. These regions still contain very large markets for seaborne shipments of oil, iron ore, coal and grain. They are densely populated, too. To conform to today’s realities, however, one could expand those three economically advanced and populous regions to include all of Europe, all of North America, and an Asia that extends from Vladivostok to Singapore to the Indian subcontinent, parts of the Middle East and includes the islands and archipelagoes of eastern and southeastern Asia. This, of course, amounts to a gross, mostly northern hemispheric, geographic generalisation, but it does identify three continental loci for industrial concentrations and economic growth that generate a huge portion of world trade today. To be sure there are “black holes”, rust belts, regions of economic decline. There are also new industries, new technologies, new communications, new linkages and new industrial and service locations. Modern industrial globalisation and corporate outsourcing strategies complicate the patterns of industry and commerce. Networks have become more extensive and intricate. The southern hemisphere and emerging economies are definitely part of the present and future commercial picture.
It is noteworthy that the world’s largest markets for seaborne bulk shipments of oil, iron ore, coal and grain are still in the northern hemisphere. It should be noted, too, that a relatively small number of very large oil companies and mining and steel-making enterprises have a great deal to do with three of the four major bulk commodity trades.
4.2 Crude oil
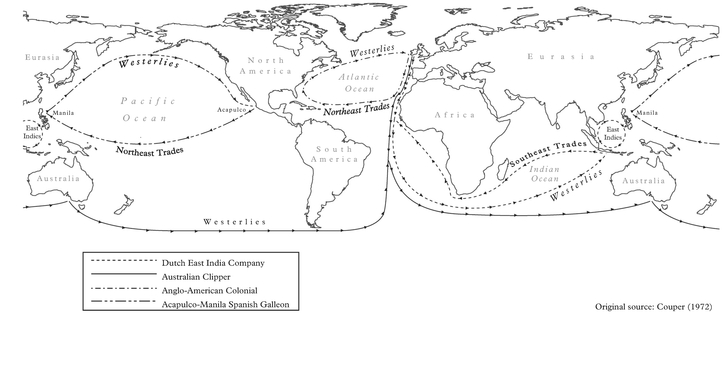
Crude oil seaborne shipments exceed those of any other bulk cargo movements, constituting nearly 24% of total world seaborne trade in 2007.5 This tanker-borne crude oil trade totaled 1,775 million metric tonnes. Figure 2 depicts origins and destinations and directions of movement of 75% of the total seaborne volume of crude oil shipments in 2007.
The major destinations for these crude oil shipments were the oil refineries of eastern Asia, western and Mediterranean Europe, and the east, west and Gulf coasts of North America. The largest crude oil importers were the United States, Japan and China. It is worth noting that the Europe that contains the enlarged 27-member European Union which, if considered a bloc, is a very important crude oil importer.6 The Middle East is the primary source of supply for these crude oil shipments but the Caribbean (Venezuela and Mexico, especially) and both West African and North African supply sources are important too. Compared to these major sources, southeast Asian oilfields, the North Sea offshore fields, oil piped to Near East terminals on the Mediterranean coast for tanker shipment onward, and Russian oil piped to Black Sea terminals generate minor, but regionally significant, tanker trades. Russia was the world’s largest crude oil producer in 2007 but domestic consumption and pipeline deliveries to points west in Europe cut back seaborne exports.
Both the United States and China have been important crude oil producers as well as consumers. Once self-sufficient, they now find themselves alarmingly dependent on
oil imports. Industrial development and a recently surging economy plus, so far, negligible domestic oil production have placed India in the same boat as the US, China and Japan as significant importers of tanker-borne oil.
Tanker itineraries depend in part on the size and loaded draft of the vessels. Very large crude carriers cannot transit the Suez Canal or the Malacca and Singapore Straits, fully loaded, and must round the Cape of Good Hope on their laden voyages to Europe, and the Lombok and Makassar Straits on their laden voyages to East Asian destinations.
Not depicted on Figure 2 is the sizeable crude oil flow from Valdez, Alaska by tanker to western US termini and refineries. This has been an US domestic, “protected” trade. Also not depicted are the refined products shipped in smaller tankers, usually on shorter voyages, for instance from Caribbean refineries to US Gulf coast and US east coast markets; and from Southeast Asian refineries to East Asian markets. The total tonnage of the oceanborne refined oil products trade amounted to 553 million metric tonnes in 2007, an impressive volume of seaborne trade, almost a third as much as the volume of the crude oil trade. Also omitted from the picture in Figure 2 is the quite significant movement of liquefied natural gas which requires specialised and expensive vessels and terminal facilities.
4.3 Iron ore
Iron ore in crude, sintered or pelletised form is shipped by sea transport from sources on all the world’s inhabited continents to metallurgical regions which have been located predominately in the northern hemisphere.
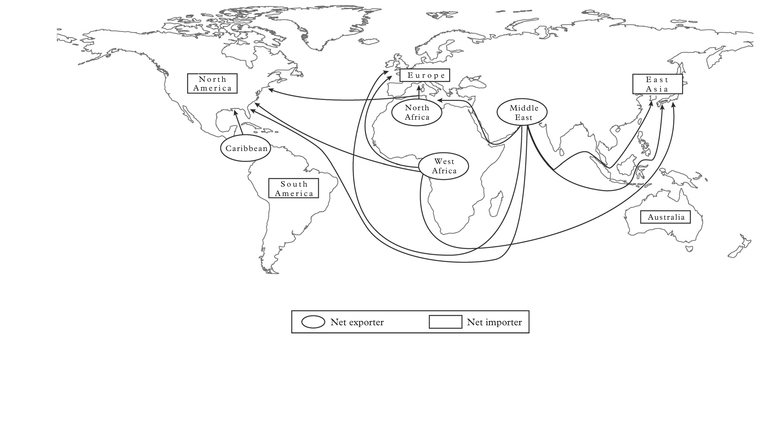
The arrowed lines of Figure 3 depict origins, destinations and directions of movement of the main oceanborne flows of bulk iron ore in 2007, representing major high volume routes and 83% of total volume of seaborne iron ore shipments in that year. Total sea-borne iron ore shipments in 2007 measured nearly 800 million tonnes, generating more than 4.5 trillion tonne-miles in ocean transport. East Asia and Europe were the big recipients. In recent years, the two countries exporting the highest volumes of iron ore have been Australia and Brazil. Australia has been a big supplier for Japanese steelworks but China has emerged in recent years as the world’s largest importer of Australian iron ore. Brazil ships large tonnages on notably large bulk carriers to European, Chinese, Japanese and other East Asian (e.g. South Korean, Taiwanese) market destinations. Again, China is the leading importer. South Asian (especially Indian) exports of iron ore have climbed steadily. Once again the Chinese market beckons. There are numerous iron ore sources in Africa but, in total, they generate comparatively small volumes for export mainly to Europe and East Asia. Canadian and Swedish mines produce quite impressive volumes of iron ore for export usually in rather short-distance seaborne trades to near neighbours such as the US, Germany, UK, etc.
The size of the dry bulk vessels carrying the ore affects the exact itineraries and limits the ports that can be used in the ore trades, although not quite as remarkably as in the crude oil trades. It should be noted that long-distance ore trades, as on the Brazil–Far East route, generate large annual tonne-mile totals. Very large ore carriers, some of more than 300,000 deadweight tonnes, have performed well on an itinerary that swings south of the Cape of Good Hope and through the Indonesian archipelago via the Lombok and Makassar Straits.
Metallurgical enterprises in the heavily industrialised regions of the northern hemisphere have drawn for a long time on their own iron ore deposits as well as on imported
ores. Four of the world’s five largest steel producers – China, Russia, the US, India – have been large iron ore producers in the past but China has emerged as the world’s largest iron ore importer. This relates to her needs as the world’s largest steel producer. Japan, Germany and South Korea now rely mostly on seaborne ore imports. The anticipated twenty-first century scale of steel production will require supplementing the old and, in some cases, depleted or uneconomically low grade, northern hemispheric sources of iron ore supply. The southern hemisphere possesses the richer and more abundant supply sources.
4.4 Coal
“Hard coal” includes steam coal, an important industrial and thermal power plant fuel and the somewhat higher grade coking coal, heavily used in its beneficiated form (i.e. coke) as blast furnace fuel in iron and steel works. These were the primary energy resources of the Industrial Revolution. There were abundant coal deposits in the European and North American industrial regions, fueling their rapid nineteenth and twentieth century growth. In more recent times north Chinese coal mining spurred massive Chinese development of heavy industry. Today China is both the world’s largest producer and the largest consumer of hard coal.
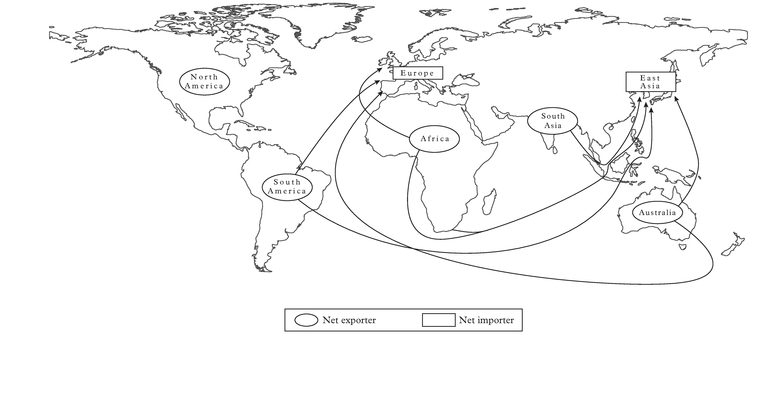
Total seaborne movements of hard coal in 2007 measured slightly over 800 million tonnes, generating almost 3.8 trillion tonne-miles of ocean transport. Figure 4 depicts the major routes accounting for 65% of the total seaborne movement of hard coal in 2007. Close to three quarters of the total seaborne coal shipments are steam coal; therefore only one quarter, the coking coal, is directly dependent on the state of the iron and steel industry.7
Australia has recently outstripped all other coal exporters and the Japanese market has been particularly important to them. Chinese and Indonesian steam coal exports have recently cut into Australia’s East Asian markets, however. South African steam coal exports to Europe and Asia constituted quite steady volumes over the last decade. Quite a few years ago an interesting shipping pattern was developed, combining US coal exports from Hampton Roads with South African exports to the East Asian market.