Measuring Business Performance in Shipping
Chapter 22
Measuring Business Peformance in Shipping
Photis M. Panayides*, Stephen X. H. Gong† and Neophytos Lambertides‡
1. Introduction
The success or failure of any business depends to a large extent on valid and reliable assessment of performance. Despite the importance of performance measurement, there is a relative gap in the context of the shipping industry. The gap is reflected in the absence of a consistent and coherent stream of research and literature that deal with the issue of how shipping companies measure their performance and what techniques, methods and measures are actually available to improve the process and outcomes of performance measurement. For instance, performance may be related to economic or financial performance and measured using accounting ratios or other financial measures. Performance may also be related to efficiency and the effective utilisation of inputs into a production process, which in this case, includes not only the provision of transportation services but also the process of managing the transportation business and the performance of the business entity. A key issue in the context of the shipping industry is to develop a stream of research that would deal with the different approaches to performance measurement and their application to the major sectors of the shipping industry viz. dry bulk, tanker and container shipping. A stream of research dealing with the measurement of business performance in shipping would also provide useful managerial implications, not least because it will enable managers to assess the performance of their companies and operations and therefore provide a basis for further improvement.
2. Approaches to Performance Measurement: A Literature Review
Performance measurement of organisations has received extensive attention in the literature, since firm performance is the bottom line of a business. Performance reflects the outcome of the implementation of any strategic task and whether such outcome is deemed to be successful or disastrous.
One of the most widely used operational measures for evaluating firm performance is market share, which also serves as a surrogate measure of firm profitability (Tanriverdi and Lee, 2008). Studies that have focused on sectors characterised by network externalities, customer switching costs, and lock-in have used market share as a performance measure. A firm’s market share is measured as the sum over all product markets of the sales-weighted shares of each market (Tanriverdi and Lee, 2008). Other studies, however, have used subjective means to capture market share and proved that subjective measures are as good as the objective ones. Jain and Bhatia (2007), adopting the method of previous studies, have used a “structured non-disguised” questionnaire which requires respondents to state their perceptions on their firm’s market share on a five-point Likert scale.
Nonetheless, most studies in the literature have consistently used accounting-based ratios or measures to assess firm performance. Such measures include Return on Assets (ROA) (Hawawini, Subramanian and Verdin, 2003; Short, et al., 2007; O’Sullivan and Abela, 2007; Morgan, Vorhies and Mason, 2009), Return on Investment (ROI) (Hult, Ketchen and Slater, 2005; Nadkarni and Narayanan, 2007), Return on Capital (ROC) (Capon et al., 1988), Return on Sales (ROS) (Makino, Isobe and Chan, 2004; Boone and Hendricks, 2009), Return on Equity (ROE) (Luo, Aric and Tse, 2007; Hult, Ketchen and Slater, 2005), Return on Capital Employed (ROCE) (Rajagopalan, 1997), and Return on Invested Capital (ROIC) (Christensen and Montgomery, 1981).
Accounting-based measures have been criticised by researchers as being unsuitable for assessing firm performance. They are historic in nature and do not focus on the firm’s future performance or potential. What is more, the differences in accounting policies and in methods of consolidating accounts and the possibility of distortions due to depreciation policies, inventory valuation, and specific treatment of income and expenditure items make their sole use to evaluate firm performance problematic (Chakravarthy, 1986). Hawawini et al. (2003) point out that one important aspect of firm performance is the creation of value for the firm’s shareholders, in terms of earning returns greater than the cost of capital. However, accounting-based measures do not take into consideration the cost of capital or the replacement value of assets and are thus inadequate to measure the value the firm offers to its shareholders. On top of this, Chakravarthy (1986) suggests that a firm should provide value not only to its shareholders but also to the other stakeholders of the firm, such as customers, employees, and the community, in terms of product or service quality, ability to keep and develop talented people, and responsibility towards the community. Clearly, accounting-based measures do not reflect the value the firm is producing for its stakeholders.
Other studies (e.g. Morgan and Rego, 2009), in an attempt to overcome the disadvantages previously mentioned, have assessed firm performance by using Net Operating Cash Flow (defined as “EBIT + Depreciation – Taxes”) and Cash Flow Variability (defined as “the coefficient of variation of the net operating cash flows”). The first reflects current shareholder value and is less dependent on the accounting practices of the firm, while the latter takes into consideration the risk level and captures the stability of a firm’s cash flows.
Hawawini et al. (2003) measure the economic performance of a firm, instead of the accounting performance. Measures of economic performance are based on the concept of residual income, and take into account capital costs, risk, and the time value of money. Unlike traditional accounting measures, they do reflect shareholder value and are not affected by accounting policies. As measures of performance, Hawawini et al. (2003) use Economic Profit (EP) per dollar of Capital Employed (CE) and Total Market Value (TMV) per dollar of Capital Employed (CE), where capital employed is the sum of equity capital and debt capital. The two measures are defined as follows:

where:
ROIC = Return on Invested Capital;
WACC = Weighted Average Cost of Capital;
NOPAT = Net Operating Profit after Taxes;
If ROIC is greater than WACC, economic profit per dollar of capital employed is positive and the firm creates value.

Where:
TMV = Sum of the firm’s market capitalisation (market value of equity) and the market value of its debt;
If TMV is greater than CE, the firm is deemed to have increased the value of capital invested in the firm and created value.
Many other studies (Griffith, 2004; Bacidore, et al., 1997; Ryan and Trahan, 2007) use economic profit-related performance measures, such as Economic Value Added (EVA), Refined Economic Value Added (REVA), Shareholder Value Added (SVA) or Cash Flow Return on Investment (CFROI). One of the most important economic performance measures is Economic Value Added (EVA), which was developed by Stern Stewart & Co. EVA is defined as “NOPAT – Cost of Capital* Amount of Capital” and it attempts to relate the firm’s accounting data to its stock price. Value-based performance systems are deemed significant in the performance measurement literature, as they drive value creation (Hawawini et al., 2003).
Another important market-based measure, which is widely used to assess firm performance, is Tobin’s Q (Short et al., 2007; Chari, Devaraj and David, 2008; Uotila et al., 2009). Tobin’s Q is defined as “the sum of the market value of equity, the book value of debt, and deferred taxes divided by the book value of total assets minus intangible assets” (Thomas and Waring, 1999). Tobin’s Q compares a firm’s market value with the replacement value of its assets; it reflects the investors’ views on how the firm will generate value. A value of Tobin’s Q greater than 1 implies that the investors assess that the firm will generate greater value from its asset stock than if the assets were deployed outside the firm (McGahan, 1999).
Heiens, Leach and McGrath (2007) use market adjusted holding-period returns (HPR) to assess firm performance. The market adjusted HPR is defined as “the compounded market holding period return minus the compounded stock holding period return”. Other studies (e.g. Brammer and Millington, 2009) use risk-adjusted HPR as a performance measure, since it takes into consideration the risk of share ownership. This is defined as:

where:
Pt= The market price of the firm’s share at time t
Pt-1= The market rice of the firm’s share at time t-1
DIVt = The dividend paid by the firm at time t
RISKFREEt= The rate of return for a government bond at time t
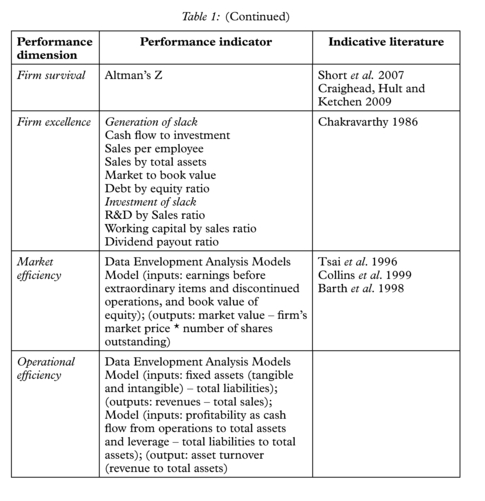
Nevertheless, many researchers are of the view that there is no single accounting or financial measure that can adequately capture all aspects of firm performance. Therefore, instead of relying on only one measure to determine firm performance, a multi-factor model should be used. Altman’s Z is one such multi-factor performance-measurement model. Altman’s Z, an established measure of credit default risk, has received increasing consideration in the literature of performance measurement (Short et al., 2007; Craighead, Hult and Ketchen, 2009). Bankruptcy is considered by more and more managers as a strategic alternative (Short et al., 2007); thus a measure which incorporates this tendency is significant when appraising firm performance in order that the prospects for firm survival are captured (Altman et al., 1981).
Altman’s Z is calculated as follows:

where:
a = working capital
b = retained earnings
c = operating income
d = sales
e = total assets
f = net worth
g = total debt
According to Chakravarthy (1986), Altman’s Z can be a valuable index of the firm’s well-being, since by measuring the distance from bankruptcy, the Z factor can be a surrogate measure of strategic performance. However, Altman’s Z is flawed in the sense that a well-managed firm does not devote all of its resources only in the avoidance of bankruptcy. Moreover, the calculation of the Z factor is mostly an empirical result rather than the result of theory.
Hence, an alternative multi-factor measure has been proposed by Chakravarthy (1986). Chakravarthy (1986) deals with the term “firm excellence” and asserts that strategic management is the process through which managers ensure the long-term adaptation of the firm to its environment. In this way, the useful measures of performance are those that help assess the quality of the firm’s adaptation to its changing environment. A firm needs to be evaluated on the basis of how well it serves all of its stakeholders (not just its stockholders) and of how well it manages the net surplus of its slack resources. The slack resources will improve the firm’s ability to adapt to uncertain or unknown future events. Therefore, the firm should be able to transform itself and adjust to the changing environment around it. Chakravarthy (1986) selects eight slack variables to represent the ability of firm transformation: Cash Flow to Investment ratio, Sales by Total Assets, R&D by Sales ratio, Market to Book Value, Sales per Employee, Debt by Equity ratio, Working Capital by Sales ratio, and Dividend Payout ratio.
Despite the widespread use of the various financial measures mentioned above, there has been increased use of non-financial measures to evaluate firm performance. Proponents of such measures insist that non-financial measures are better predictors of long-term performance than financial measures and help management focus on the long-term effects of their actions (Banker, Potter and Srinivasan, 2000). One of the most important non-financial measures used is customer satisfaction (Ittner and Larcker, 1998; Banker et al., 2000; Jain and Bhatia, 2007). Other measures include productivity (Koka and Prescott, 2008), product quality (Wisner, 2003), and manufacturing-related measures, such as cycle time, lead time, setup times or inventory turnover (Perera et al., 1997; Dehning et al., 2007).
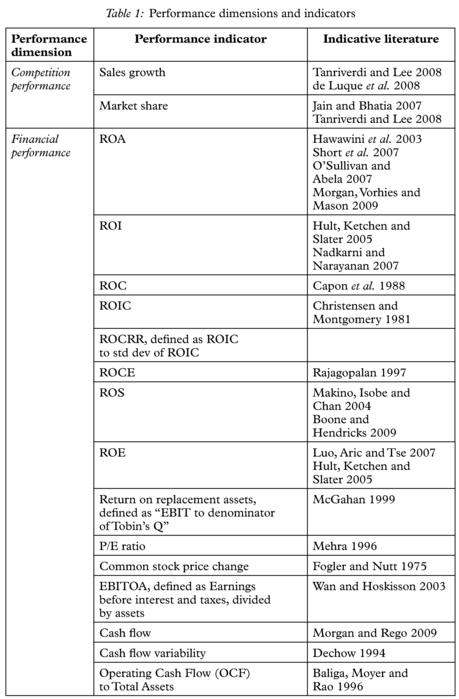
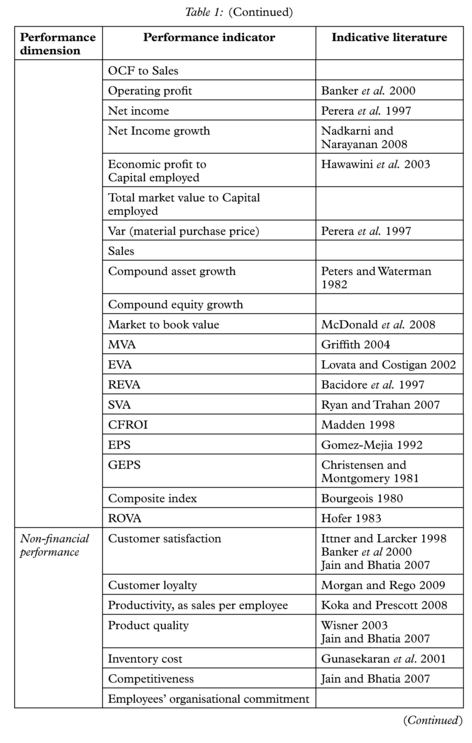
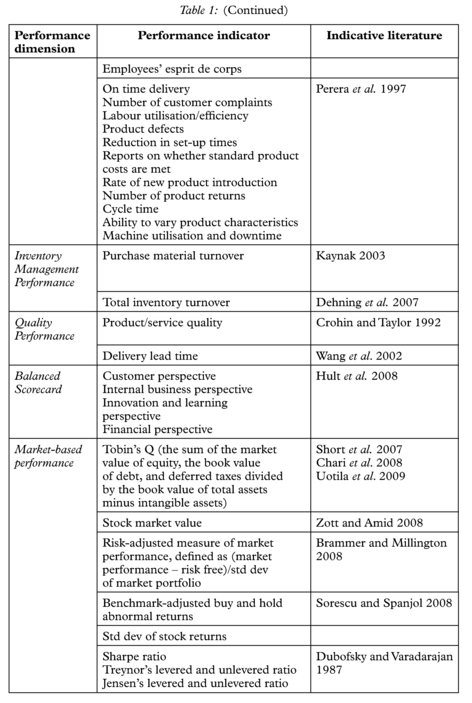
One of the most important performance measurement systems in the literature is the Balanced Scorecard (Kaplan and Norton, 1992; Hult et al., 2008). Kaplan and Norton (1992) assert that no single performance measure can incorporate all the critical areas of a business; thus, they developed four sets of perspectives that the firm should focus on to evaluate its performance. These perspectives are: customer performance, financial performance, internal process performance, and innovation and learning performance. The measures which will be included in each category will depend on the firm, its goals, and the type of business it is into, but could include lead time, on-time delivery, growth, profitability, cycle time, productivity or ability to launch new products. The Balanced Scorecard’s effectiveness lies in the fact that it reduces information overload, as it limits the number of measures used and that it ensures the optimisation of the whole system, instead of the subsystem. Table 1 presents a summary of some key papers in the firm performance measurement literature together with the performance dimensions and indicators used.
3. Performance Measurement of Shipping Companies
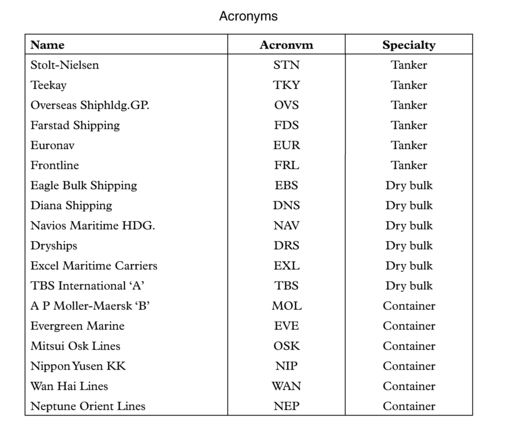
To determine the extent to which the performance of the maritime industry has been subjected to systematic examination, a key word search in the electronic databases of the major shipping/transport journals was undertaken. The journals targeted include Maritime Policy and Management (MPM), Transportation Research (Part A and Part E), Journal of Transport Economics and Policy (JTEP), Transport Policy (TP), Transport Reviews (TR), and Maritime Economics and Logistics (MEL, formerly
known as the International Journal of Maritime Economics). The majority of the papers identified examine productivity/efficiency issues related to ports or container terminals. As there are already some good reviews on port/terminal productivity (see, for example, Cullinane, 2002; Panayides et al., 2009), we focus here on the performance of shipping companies. Less than a dozen papers have examined this important issue. We make reference to studies outside of shipping firms where appropriate.
The existing studies on the performance of shipping companies may be divided into three main types: the first branch of the literature focuses on firms’ financial performance or operational performance/efficiency, the second on the stock market performance (i.e. risk and return) of the listed firms, and the third on other aspects of performance (e.g. third-party rated performance or self-evaluation of performance). The sub-sections below first review the main research findings of the relevant studies, organised in chronological order. This is followed by an evaluation/critique of the research designs and key results of the said studies. Future research directions and opportunities are then discussed.
3.1 Studies of the financial/operating performance of shipping companies
Randoy, Down and Jenssen (2003) examine the effect of corporate governance mechanisms on the financial performance of 32 publicly traded maritime firms from Norway and Sweden during the period 1996–1998. Using Return on Assets (ROA), Return on Equity (ROE) and Return on Sales (ROS) as the measure of firm performance, they find (through regression analysis) that maritime firms with a founding family CEO have better financial performance than maritime firms with a non-founding family CEO; a high level of board independence enhances profitability in maritime firms; but there is no significant relation between the level of board ownership and firm profitability in maritime firms, although board ownership control is significant in a control sample of manufacturing firms. The authors focus on cross-sectional analysis and provide minimal evidence on the extent to which the sample maritime companies perform, either in absolute terms or relative to a chosen benchmark. The same criticism applies more or less to the other studies reviewed in this sub-section.
Lam, Yap and Cullinane (2007) investigate the structure, conduct and performance of major liner shipping routes during the period 1998–2002. They measure performance using financial performance indicators such as turnover, operating profit and net profit calculated on a per-TEU basis. The results indicate that different companies experienced varying degrees of success or failure in financial performance during the period under examination, but there is no conclusive evidence of any relationship (based on correlation coefficients) between either structure or conduct and performance. The authors note that while industry structure and the conduct of shipping lines can affect performance, the direction of causality may be reversed. For instance, shipping lines that are able to reap significant benefits from the adoption of a particular form of conduct might be persuaded to repeat that strategy, whereas those shipping lines whose conduct failed to generate sufficient returns will be motivated to seek alternative strategies. Similarly, healthy financial gains will enable shipping lines to invest in greater capacity and alter the structure of the market, while poor financial performance can lead to mergers and acquisitions or even exit from the industry altogether (pp. 372–373). In conclusion, Lam, Yap and Cullinane (2007) interpret their results as providing further validation of the assertion that the structure (high levels of concentration) and conduct (e.g. inter-firm collaboration) of shipping lines are the outcomes (as opposed to causes) of low cost strategies for survival in a beleaguered shipping sector.
Lambertides and Louca (2008) examine the relation between ownership structure and operating performance of listed European maritime firms during the period 2002–2004. They adopt multiple measures of operating performance, including cash flow from operations on assets/sales, operating return on assets/sales, capital expenditures on assets, and asset turnover. Judging by these measures, the sample companies seem to be profitable in each of the years under examination, with the average (median) cash flow from operations on assets ranging from 7.3% (8.0%) to 9.4% (10.9%), whereas the average (median) operating return on sales ranges from 1.9% (4.6%) to 8.0% (8.9%). There is also a steady improvement in maritime operating performance through time. By regressing operating performance measures on ownership structure and control variables, Lambertides and Louca (2008) find that firms with more foreign shareholders and greater participation from investment companies have higher operating performance. These and other results lead them to conclude that certain types of ownership structure can result in better investor protection and hence better operating performance. They caution, however, against inferring causality from these results, as both ownership structure and operating performance might be associated with a third, omitted factor (e.g. management quality).
3.2 Studies of the stock market performance of shipping companies
One stream of the literature deals with the risk-return characteristics and behaviour of shipping company stocks and factors associated with stock market performance. Grammenos and Marcoulis (1996a) analyse the determinants of the cross-section of expected stock returns of 19 shipping companies listed in the US, Norway, Stockholm and London. Among the factors examined (company stock market beta, dividend yield, financial leverage and average age of the company’s fleet), they find that the industry-specific factor (average age of the fleet) and financial leverage are significant in explaining shipping stocks’ returns, whereas the stock market beta and the dividend yield are far less significant.
Grammenos and Arkoulis (2002) present evidence, for the first time, about the relations between global macroeconomic sources of risk and shipping stock returns for 36 internationally listed shipping companies during the period 1989–1998. The return on the world equity market portfolio and innovations in the following global macro variables are employed in the analysis: (a) industrial production; (b) inflation; (c) oil prices; (d) fluctuations in exchange rates against the US dollar; and (e) laid up tonnage. Several significant relationships are established between the returns of international shipping stocks and global risk factors. Specifically, oil prices and laid up tonnage are found to be negatively related to shipping stocks, whereas the exchange rate variable displays a positive relationship. In addition, it is found that, in general, the macroeconomic factors exhibit a consistent pattern in the way in which they are linked to the shipping industry, across countries. Kavussanos and Marcoulis (2001, 2005) provide evidence that microeconomic and company-specific factors as well as the market factor are the driving force behind shipping companies’ stock returns.
Grammenos and Arkoulis (2001) examine the long-run performance (for the initial 24 months subsequent to public listing) of 27 shipping initial public offerings (IPOs) issued in the stock exchanges of seven different countries during the period 1987–1995. By measuring aftermarket performance respectively against the local stock market indices and against the Morgan Stanley Capital Market (MSCI) index for the shipping equity market, they find that the shipping IPOs underperform the local stock market indices by as much as 36.79% by the end of the second anniversary of public listing, but there is no evidence of underperformance relative to the MSCI shipping index. They further find that the two-year holding period returns of the sample firms are positively related to the initial level of gearing and negatively related to the fleet age of the companies at the time of the offering. In an earlier study, Grammenos and Marcoulis (1996b) find relatively small but statistically significant underpricing for 31 shipping IPOs worldwide during the period 1983–1995. In contrast, Cullinane and Gong (2002) find substantial underpricing for 50 transportation IPOs in stock exchanges in Hong Kong (with an average underpricing of approximately 44%) and the Chinese mainland (with an average underpricing of approximately 126%) during the period 1972–1998. The 23 shipping IPOs on average experienced as much as 126% underpricing, which is statistically higher than that for toll roads, freight forwarders and airlines. They attribute the higher level of underpricing for shipping IPOs to the fact that, relative to other types of transport companies which are typically guaranteed regular incomes through their status as monopolies or franchises, the (usually freight-related) shipping companies are associated with a higher level of ex ante uncertainty and thus they need to offer investors a higher level of initial day returns in order to compensate investors for the higher risk involved. With the benefit of hindsight (and based on the results in other related research), it is possible that the investors might have simply overpaid for the IPOs, and that the more speculative investors in the emerging Chinese stock market are just more likely to do so than investors in the more mature stock markets.
3.3 Other studies of performance of shipping companies
Panayides (2003) examines the relationship between competitive strategy and performance in the context of ship management companies. Recognising performance as a multi-dimensional construct, he measures performance using seven items of self-reported measures constructed from questionnaires that contain instruments found to be valid and reliable by previous research as well as pre-tested with managers and academics. The study finds that companies that apply competitive strategies are more likely to be high performers. The strongest influences on performance seem to be achieving economies of scale, differentiation (in particular through a wider range of services offered), and market-focus and competitor analysis. It is suggested that high performers are more likely to pursue a combination of the generic strategies rather than pursuing one of the generic strategies in isolation.
Jenssen and Randoy (2006) investigate how innovation contributes to company performance in Norwegian shipping. They hypothesise that organisational and inter-organisational variables influence innovation and innovation in turn influences performance in the shipping firms. Performance is said to be measured by financial results, market position and bargaining power, although it is not clear from the paper how these are actually computed and why they are considered appropriate. Using regression analysis based on the results of a survey of 46 Norwegian shipping companies (divided into highly differentiated companies and low differentiated companies) and two measures of innovation (product-process innovation, PPI, and market innovation, MI), they find that PPI is positively associated with performance for the whole sample and for highly differentiated firms, but not for low differentiated firms. No statistically significant relationship is found between MI and performance. Thus, the effect of innovation on performance seems to depend on the companies’ degree of differentiation and the type of innovation. The authors suggest that future studies should use more objective information, such as accounting and financial market data, in order to gain more knowledge of the effect of innovation on performance.
3.4 Evaluation and a critique
The key objectives of most of the existing studies on the performance of shipping companies have been to investigate the relations between performance and specific aspects of corporate strategy (e.g. inter-firm collaboration, innovation, mergers and acquisitions) or governance (e.g. ownership structure and control). Few studies take it as their primary objective the determination of objective shipping company performance. It is also difficult to compare the results from the various studies because of the different research designs and the inconsistent definition and measurement of the variables used. Such comparability issues are further complicated by the fact that the sample firms usually come from, and sometimes are spread thinly over different countries, which often adopt different accounting standards and financial reporting practices.