Managing Freight Rate Risk using Freight Derivatives: An Overview of the Empirical Evidence
Chapter 26
Managing Freight Rate Risk Using Freight Derivatives: An Overview of the Empirical Evidence
Nikos K. Nomikos and Amir H. Alizadeh*
1. Introduction
Over the last decade, the tramp shipping markets have undergone a fundamental transformation. This period is characterised by very high volatility in the level of freight rates as well as the emergence, and corresponding growth in the derivatives market for freight. Traditionally, this was a market that was used by players in the physical freight market, such as shipowners, operators and trading houses, to hedge their risks although this is now changing rapidly with the increasing participation of investment banks, hedge funds and other traders that may not be involved in the underlying physical market. This has resulted in the commoditisation of the freight market. Nowadays, freight rates can be bought and sold like any other commodity, despite the fact that freight rates essentially represent the cost of providing the service of seaborne transportation and, hence, are not classified as a tangible commodity.
Overall, this has created a shipping environment where market participants are more aware of the risks they face and also try to explore avenues to hedge or manage those risks. For a ship-operator, the most important source of risk is freight rate risk. Freight rate risk refers to the variability in the earnings of a shipping company due to changes in freight rates and the importance of this risk factor stems from the fact that volatility in the freight market has a direct impact on the profitability of a shipping company. The focus of this chapter therefore is to introduce and analyse the derivative instruments that are used in the market to control freight rate risk. In particular we focus on managing freight rate risk using forward and option contracts. We describe the structure and functioning of the Forward Freight Agreement (FFA) market, the trading practices, documentation and types of contract used in the trades, applications and uses of FFAs for risk management as well as how to deal with issues such as basis risk.
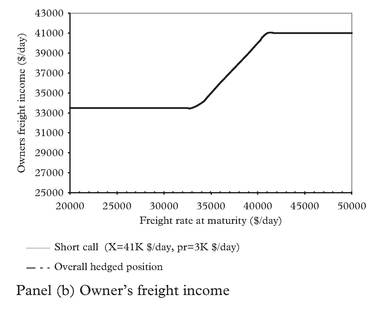
We also discuss freight options and their use in risk management and speculation. First, we consider the properties of freight options and present the profit patterns from buying or selling call and put options; we also discuss the practicalities of trading freight options and then examine risk management applications of freight options using caps, floors and collars. Finally, we also discuss the topic of options pricing and the different approaches that are currently used in the market.
It should be stressed that the emphasis on freight rate risk management in this chapter is on the tramp sector of the industry. Risk management techniques are markedly different across the liner and tramp shipping sector due to the unique characteristics of each one of those sectors. For example, while freight rates in tramp shipping are determined through the interaction of supply and demand for shipping services in a nearly perfect market, freight rates in the liner sectors are determined through “conferences” and “alliances” which are reviewed only periodically (see Stopford1 and McConville2). As a result, liner rates are less volatile compared to rates in tramp shipping and therefore the approach toward risk management used by liner operators is markedly different.3
The structure of this chapter is as follows. In the next section we present a historical overview of the freight derivatives market. In section 3 we discuss the FFA market, the practicalities of using FFAs for risk management and how to deal with the issue of basis risk. Section 4 presents the freight options market, how to use options for risk management and how to price freight options. Finally, section 5 concludes this chapter.
2. Historical Overview of the Freight Derivatives Market
The benefits of providing a futures market in freight rates had been recognised by shipping market practitioners as early as the 1960s (Gray4). However, such a market was eventually established only in 1985. The reason is that the underlying asset of the market – the service of seaborne transportation – is not a physical asset which can be delivered at the expiry of the futures contract; by its very definition, a futures contract is an agreement to deliver a specified quantity and grade of an identified asset, at a certain time in the future. This obstacle was overcome with the introduction of the cash settlement procedure for stock index futures contracts in 1982; when the underlying asset is not suitable for actual physical delivery then an alternative is to deliver the cash value of the asset at that time.
This innovation led to the development of the first exchange traded freight futures contract. Trading on the Baltic International Freight Futures Exchange (BIFFEX) contract commenced on 1 May 1985. The contract was traded at the London Commodity Exchange, which is now part of Euronext.LIFFE Exchange in London; the underlying asset of the contract was the Baltic Freight Index (BFI), a freight index that initially consisted of 13 voyage routes covering a variety of cargoes ranging from 14,000 metric tons (mt) of fertiliser up to 120,000 mt of coal. It quickly won worldwide acceptance as the most reliable general indicator of movements in the dry cargo freight market. Over the years, the constituent routes of that original index have been refined to meet the ever increasing and changing needs of the freight derivative markets. Trip-charter routes were added to the index and gradually, handysize and capesize routes were excluded from the index. As a result, in November 1999, the Baltic Panamax Index (BPI) superseded the BFI as the underlying asset of the BIFFEX contract.5
The asset which was delivered at the settlement date of the futures contract was the cash equivalent of the general level of the freight market at that time as represented by the level of the BFI. The settlement price was computed as the average value of the index over the last seven trading days of each contract month and the monetary value of the settlement price was $10 per index point. The introduction of the BIFFEX contract gave, for the first time, the opportunity to shipping market agents to control their freight rate risk in the physical market, through hedging. This was an entirely “paper” financial transaction and no real ships or cargoes were involved. Additionally, through the price-discovery function, futures prices could also help reveal information about expected spot prices and, hence, provide valuable signals to market agents regarding the likely future direction of freight rates in the markets; this was shown empirically by Nomikos6 and Kavussanos and Nomikos.6–8 Although the BIFFEX contract was quite innovative at its time, it quickly became apparent that the heterogeneous composition of the underlying index, affected dramatically the performance of hedges in the market. This was due to the fact that futures prices did not capture accurately the fluctuations on the individual routes that comprised the BFI but, rather, followed the movements of the BFI itself. Effectively therefore, hedging on BIFFEX was like a cross-hedge.
Unlike other futures markets, in which futures contracts are used as a hedge against price fluctuations in the underlying asset, in the BIFFEX market futures contracts are employed as a cross-hedge against freight rate fluctuations on the individual shipping routes which constitute the BFI. As such, there is the risk that fluctuations on these routes may not be accurately tracked by the futures prices, thus, reducing the effectiveness of the contract as a hedging instrument. Cross-hedging freight rate risk using an index-based futures contract is only successful when the freight rate and the futures price move together. However, when a large number of underlying routes constitute an index, then the relationship between these routes and the index will not be very strong. Therefore, BIFFEX market participants, who use the contract to hedge their freight rate risk on specific shipping routes, have small gains in terms of risk reduction. In a series of studies, Nomikos6 and Nomikos and Kavussanos10,11 have shown that the hedging effectiveness of the BIFFEX contract varies from 19.2 to 4% across the different shipping routes which constitute the underlying index. This is well below the risk reduction evidenced in other commodity and financial markets which ranges from 70–99%.
The poor hedging performance of the contract is also thought to be the primary reason for the low trading activity evidenced in the market. Figure 1 presents the volume of trade for the BIFFEX contract, for the period from 1994–2002. Over the period from February 1996 to June 2000, the average daily trading volume in the market was only 146 contracts. The daily monetary value of these contracts roughly corresponds to the average freight cost of transporting 108,000 tonnes of Grain from the US Gulf to Japan; market sources estimate that this level of futures trading activity corresponds to only 10% of the total physical activity in the dry-bulk shipping market, during the same period. As a result of the lack of trading interest in the market, the BIFFEX contract was eventually de-listed in April 2002.
The reduction in the trading activity of the BIFFEX contract after the mid-1990s was also due to the development of an over-the counter forward market for shipping freight called Forward Freight Agreements (FFA), which are cash-settled against an underlying shipping route. Because of the fact that these contracts are traded against specific routes, rather than a general index, they also eliminate the problem of basis risk,
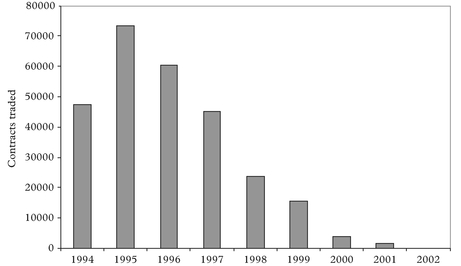
Source: Euronext.LIFFE. Each contract trades the expected value of the BFI. The value of each contract is $10 per index point.
evidenced in the BIFFEX market. The mechanics of the FFA contracts are described in the next section.
3. Forward Freight Agreements
From the early 1990s a new market for trading the forward value of freight emerged, primarily as a response to the needs of market players who were aware of the deficiencies of the BIFFEX contract as a hedging instrument and wanted a hedging tool which would provide a more precise match to their exposure in the physical market and, hence, a more accurate hedging mechanism. A Forward Freight Agreement (FFA) is an agreement between two counterparties to settle a freight rate or hire rate, for a specified quantity of cargo or type of vessel, for one of the major shipping routes in the dry-bulk or the tanker markets at a certain date in the future. The underlying asset of the FFA contracts can be any of the routes or basket of routes which constitute the indices produced by the Baltic Exchange, or by other reputable providers of underlying market information, such as Platts.
Currently, the Baltic Exchange produces a wide range of shipping indices covering different vessel sizes and different cargo types, such as the Baltic Panamax Index (BPI), which reflects freight rates for Panamax vessels of 74,000 metric tonnes (mt) dead-weight (dwt); the Baltic Capesize Index (BCI) – for capesize vessels of 172,000 mt dwt; the Baltic Supramax Index (BSI) – for Supramax size vessels of 52,000 mt dwt; and the Baltic Handysize Index (BHI) – for Handysize vessels of 28,000 mt dwt. In addition, there are indices covering the movement of tanker cargoes: The Baltic Clean tanker Index (BCTI) and Baltic Dirty Tanker Index (BDTI). The current composition of the BPI is presented in Table 1. We can see that the index consists of four trip-charter routes; Route P1A_03 is the trans-Atlantic route for a voyage across the Atlantic; the charterer takes delivery of the vessel in the continent in the range between Cape Skaw (in North Continent) and Gibraltar; the vessel will go across the Atlantic to either US Gulf, East Coast South America or East Coast North America for transportation of cargoes back to the Continent, where the vessel will be re-delivered. Similarly, Route P2A_03 is the trip out to the Far East. The vessel is delivered in the Continent to perform a voyage to the Far East for redelivery in the region between Taiwan and Japan. Route P3A_03 is the Trans-Pacific panamax route where the vessel is delivered in the range between Japan and South Korea for a voyage to load cargo in Australia or North Pacific and then redeliver the vessel to the same region. Finally, route P4_03 is the return leg of Route P2A_03 where the panamax vessel is delivered in the Far East for a voyage to the continent via the West Coast of US. All these trip-charter routes are estimated on the basis that the trip is performed by a standard “Baltic Panamax” vessel, the particulars of which are presented in Table 1.12
FFAs are settled in cash on the difference between the contract price and an appropriate settlement price. The settlement rate is usually calculated as the average of the underlying route over the settlement month, although there are some exceptions to that general rule.13 The calculation of an average settlement rate is used in order to ensure
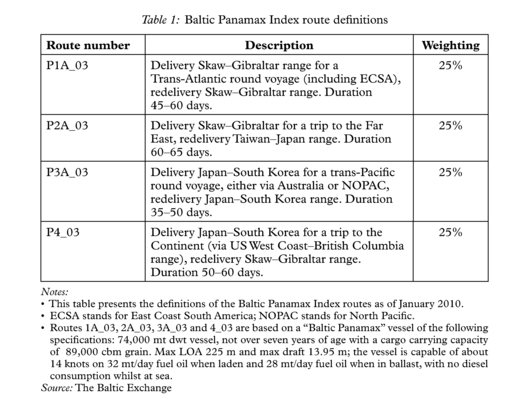
Source: The Baltic Exchange
that settlement rates are not susceptible to large moves due to very high volatility or market manipulation on any specific trading day. Although trades are possible for every route published in the market, there seems to be a tendency for trades to concentrate on certain routes only. For instance, in the Panamax market the majority of the trades are on the BPI four TC average, which is the equally weighted average of the four TC routes of the BPI.
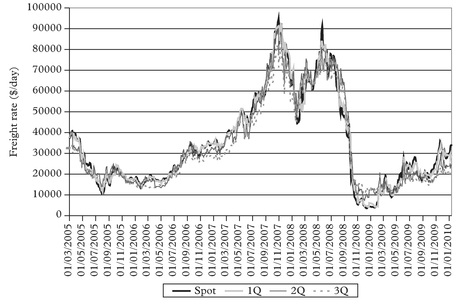
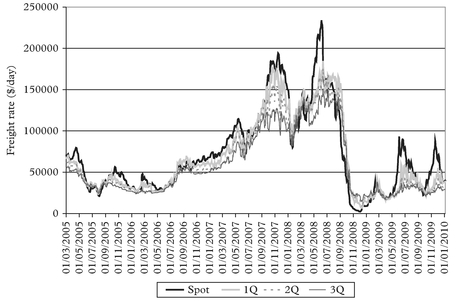
Figures 2 and 3 present the spot and FFA rates for the first three quarters for the average of the four trip-charter routes of BPI and BCI, respectively. The graphs cover the period from March 2005 to January 2010. We can note that there is a strong degree of co-movement between the spot and FFA rates. The strength of the relationship is also evident during the collapse of the market in the fourth quarter of 2008 when freight rates for Capesize vessels dropped from a peak of 240,000 US$/day in July to a rate of less than 5,000 US$/day in November. We can see that during that period FFA rates followed the spot market very closely. Finally, we can also note that as we move from the spot to the forward rates, the forward rates appear to be less volatile than the spot rates, which is indicative of a volatility term structure pattern in the forward rates.
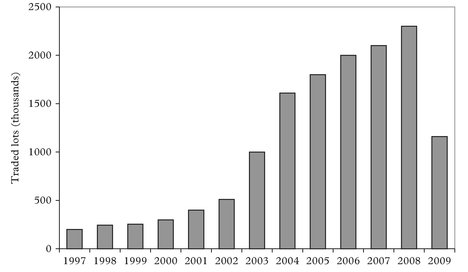
The FFA market has evidenced considerable growth over the period from 2005 to 2008 as a result of the surge in freight rates, particularly in the dry sector, which also resulted in an increase in the use of freight derivatives for risk management purposes. Market volatility has also generated trading interest from players outside of the shipping markets; therefore, over the recent years we evidenced an influx of new participants in this market such as investment banks and hedge funds. Figure 4 presents the volume of trades in the FFA market for the period 1997 to 2009; these figures are
Source: The Baltic Exchange
estimates provided by the London-based FFA broker Freight Investor Services (FIS) (until 2007) and the Baltic Exchange (from 2007 onwards) and reflect the estimated number of lots which have been traded in the dry market; the market convention is to measure the volume of trades in terms of lots where one lot either represents 1,000 mt of cargo carried or one-day of trip-charter hire. From 2005 to 2008, the average annual growth in the FFA market was 10%. However, the sudden drop in freight rates during the fourth quarter of 2008 resulted in a corresponding reduction in the activity in the paper market. As a result, trading volume in the fourth quarter of 2008 was less than 15% of the total for the year; trading volume in 2009 also remained in low levels and was at half the level of trading in 2008, although the second half of the year saw an increase in trading interest, compared to the first half.
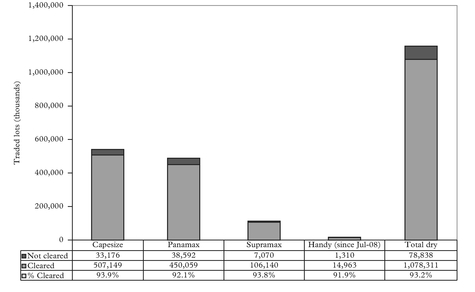
Since July 2007, information on the volume of trade has also been reported by the Baltic Exchange. This information is provided to the Baltic Exchange on a weekly basis by major international FFA brokers, Clearing Houses and Exchanges, and is then aggregated and reported to the market. In the dry sector, trading volume, defined as lots traded, is estimated for the Capesize, Panamax, Supramax and Handysize markets, and the trades are also classified as to whether they are cleared or not; as in the previous case, a dry lot is defined as either one trip-charter day or 1,000 tonnes of voyage-based ocean transportation. In each case a single transaction, although having a buyer and a seller, is counted only as one lot. Figure 5 presents the volume traded by contract type for 2009.
We can see that of the total volume, about 45% of the trades are on the Capesize market, 39% on Panamax, 10% on Supramax vessels and the remaining 6% in the
Note: Each lot corresponds to either 1,000 tons of cargo or one day of TC hire. Source: Freight Investor Services (FIS) and the Baltic Exchange. Reported figures are market estimates.
Source: The Baltic Exchange. Reported figures are market estimates provided by major FFA brokers and Exchanges. Each lot corresponds to either 1,000 tons of cargo or 1 day of TC hire.
Handysize sector. This pattern in the distribution of FFA trades amongst the different size vessels is not in line with the distribution of the world total fleet where currently 40% of the world trade is conducted by Handysize and Supramax vessels, 40% through Panamaxes and only 20% through Capesizes. The low volume in the Supramax and Handysize FFA sectors may be attributed to the fact that, for the smaller sizes, the underlying shipping market is more fragmented, with smaller trades not represented by the Baltic Indices, as opposed to the panamax and capesize sectors. Finally, it is also interesting to note that currently more than 90% of the contracts are cleared via one of the clearing houses. This increased considerably compared to 2008 and 2007, when the percentage of cleared contracts was only 40%, and reflects the tighter credit conditions that prevailed in the market in 2009.
3.1 How are forward freight agreements traded?
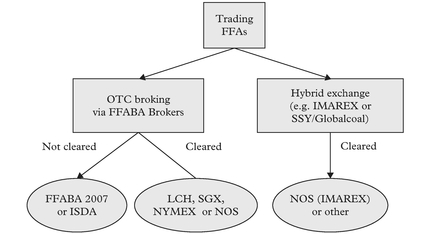
Forward Freight Agreements can be traded either over the-counter (OTC) or through an organised exchange such as the International Maritime Exchange (IMAREX), as shown in Figure 6. Trading in the OTC market, takes place though specialist FFA brokers via “traditional” telephone based broking. Trades can be either on the basis of a principal to principal contract between the two counterparties, using one of the standard contract forms that are used in the market, such as FFABA 2007 or ISDA Master Agreement, or, alternatively, trades may be cleared through one of the clearing houses that provide services to the freight market, such as the London Clearing House (LCH.Clearnet), the Singapore Exchange (SGX) AsiaClear Service, the Norwegian Futures and Options Clearing House (NOS) or the New York Mercantile Exchange (NYMEX). In addition, FFAs can also be traded through a “hybrid” exchange, the most popular of which is the International Maritime Exchange (IMAREX);14 IMAREX provide a trading screen where standardised contracts are traded, which are then
Source: Alizadeh and Nomikos16
cleared straight through NOS. A more detailed discussion of these trading options is presented in Alizadeh and Nomikos.15
3.2 Hedging using forward freight agreements
Market agents are confronted with risks that arise from the ordinary conduct of their businesses. Derivative markets provide a way in which these risks may be transferred to other individuals who are willing to bear them, through hedging. Hedges are either short or long. A short or selling hedge involves selling FFAs as a protection against an unexpected decline in freight rates; for instance, shipowners or ship operators who want to protect their freight income can sell FFAs – since when freight rates fall, the reduction in the freight income will be compensated through a gain in the forward position. A long or buying hedge, on the other hand, involves buying futures as a protection against a price increase. For instance charterers can buy FFAs; this enables them to protect their forward freight requirements, in case the physical market rises, thus forcing them to pay higher freight rates. FFAs were initially traded for risk management purposes by charterers and shipowners although, currently, they are also used for the purpose of speculating on the future direction of the freight markets. The following example illustrates the use of FFAs for hedging purposes.
3.3 Trip-charter hedge
This is an example where we consider the use of BPI FFA contracts to hedge panamax earnings for a period of six months. An owner operates a 65,000 mt dwt panamax vessel built in 1997. Currently, on 10 October 2005, the vessel is under a six-month time-charter for 22,000 $/day which will expire in three months, around the middle of January. Under the terms of the charter the vessel will be re-delivered to her owner at around 10–15 January 2006 in the Far East. The owner is worried about the possibility that the market may soften when the vessel will be open in the market and he, thus, decides to hedge the vessel’s earnings for the first six months of 2006. Since he wants to hedge against the volatility in the Panamax sector, the most appropriate strategy is to sell the four TC average of the BPI for Q1 and Q2 2006. Freight Investor Services (FIS) quote FFA rates of 21,750 $/day and 20,750 $/day for Q1 and Q2 2006, respectively, as shown in Table 2. Effectively each one of those contracts is a strip of three monthly
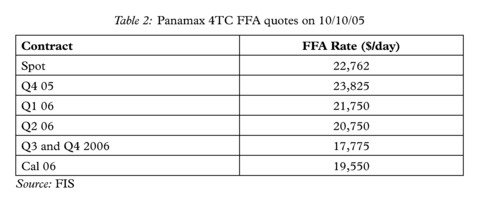
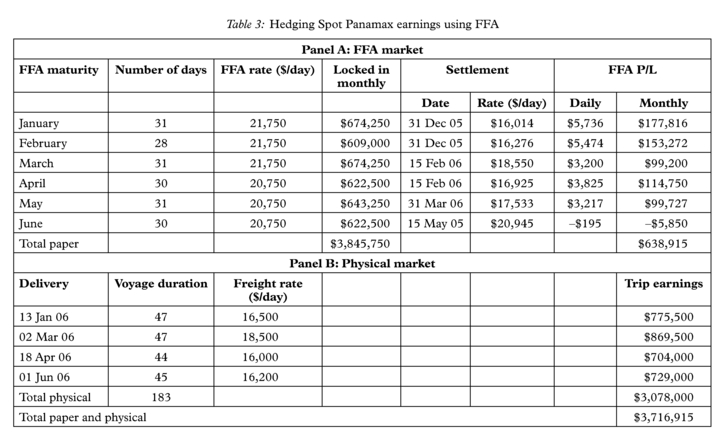
FFA, covering the respective quarter, at the given rate. He thus sells Q1 2006 at 21,750 $/day and Q2 2006 at 20,750 $/day which he holds until he can find suitable employment for his vessel. By selling the FFAs for January and February, the owner locks in a charter rate of 21,750 $/day for each day in January and February, which implies monthly earnings of $674,250 (=21,750 $/day* 31) for January and $609,000 (=21,750 $/day * 28) for February.
In order to illustrate how this hedging strategy can be implemented, we are going to consider two different variations regarding the owner’s choices in the physical market. In the first case, the owner will be operating the vessel in the spot market and as he fixes a voyage he will be gradually unwinding some of his FFA positions; in the second case, the owner will fix his vessel on a period time-charter basis for the first six months of 2006 so that he will have to unwind his entire FFA portfolio at once. Consider each case next.
3.3.1 First case — Shipowner operates his vessel in the spot market
In the first case, the owner decides to operate the vessel in the spot market. He feels that the Pacific basin presents the most attractive employment opportunities, so he will be fixing the vessel for consecutive Trans-Pacific round voyages (i.e. route 3A of the BPI in Table 1) for the next six months. The first voyage is fixed at around the end of December 2005 for delivery to take place in the middle of January; the vessel will be chartered for a Trans-Pacific round voyage (route BPI 3A) for an estimated voyage duration of 47 days at around 16,500 $/day. In this case, the vessel is fixed approximately 15 days before the date it is actually delivered to the charterer, which corresponds to the laycan for that route.16
The owner has now secured employment for his vessel from the middle of January until the end of February (47 days) and, as a result, he no longer requires the hedging position for January and February. He thus unwinds the January 2006 and February 2006 contracts at a rate of 16,014 $/day and 16,276 $/day, respectively.17 The outcome of this strategy is presented in Table 3. The hedging position is closed as soon as the owner has secured the next voyage for the vessel, at around the end of December 2005, and the FFA contracts for January and February are thus settled at 16,014 $/day and 16,276 $/day, respectively. For instance, for the January contract, this results in a profit of 5,736 $/day (=21,750 – 16,014) or a total profit of $177,816 (5,736 * 31) for the entire month of January. The vessel is then delivered to the charterer for the TransPacific round voyage at 16,500 $/day for a voyage duration of 47 days resulting in trip earnings of $775,500, as shown in Panel B of Table 3.18
The vessel will be delivered back to her owner in early March, so the owner needs to make provisions for fixing her next voyage. Around the middle of February the vessel is fixed for another Trans-Pacific round voyage of 47 days for 18,500 $/day, for delivery in early March. Again, as soon as the owner has secured employment for his vessel for the next 47 days, he has to unwind his FFA positions for March and April. He thus settles his short March and April FFA contracts at a rate of $18,550 $/day and at 16,925 $/day, respectively, as shown in Table 3. Notice as well that by closing the April contract when he fixes the second voyage, the owner no longer has cover against freight rate changes for the second part of April. This can be important because the vessel will be open again after 18 April so the owner will be exposed to freight rate volatility for the period 18–30 April. One way round this, could be for the owner to close the
April contract later, when he fixes his third voyage; this of course would result in an uncovered or speculative short FFA position for the first part of April. Alternatively, the owner could settle half of his April contract (i.e. 15 days) when he fixes his second voyage and the remaining 15 days when he fixes his third voyage; this would provide a more accurate hedge but such a strategy could be hindered by the fact that liquidity in trading half months in the market is more limited.
Overall, by fixing his vessel spot, the owner would realise earnings of $3,078,000 for the first six months of 2006.