Litigation Rates Are Higher

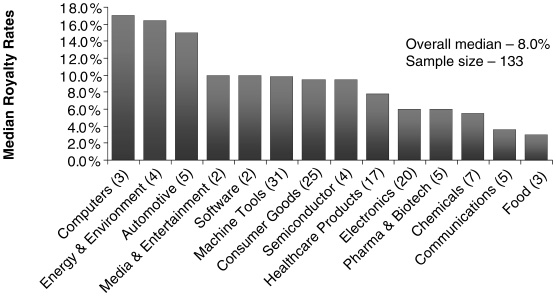
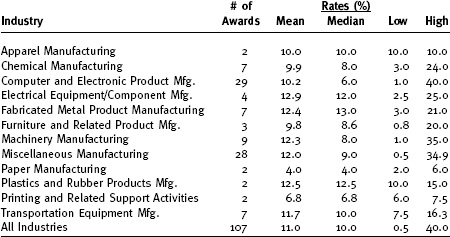
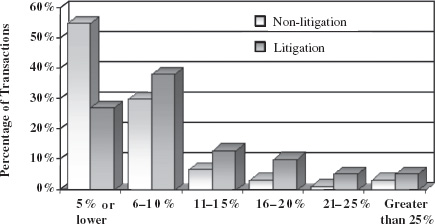
Chapter 12 Exhibit 12.1 shows royalty awards (in cases with percentage royalties) distributed by industry. The information in this chapter is taken from the book Patent Infringement Damages Statistics and Trends, 1990–2004, by Navigant Consulting, and published by Intellectual Property Research Associates (IPRA, Inc.). EXHIBIT 12.1 REASONABLE ROYALTY RATES AWARDED BY INDUSTRY: 1990—2004 (U.S. DISTRICT COURTS) Source: Navigant Consulting Patent Damages Database. The industry with the highest mean rate award, as well as the highest median award, is fabricated metal product manufacturing. Unlike the royalty rate guidance presented throughout this book, enormous royalty rates—forty percent for computers; thirty-five percent for machinery; and twenty-five percent for electrical—are not unheard of as infringement damages awards. Exhibit 12.2 compares the data on non-litigated royalty rates, with data on reasonable royalty rates awarded by the courts, presented earlier. For both litigated and non-litigated rates, an overwhelming majority are concentrated in the zero to ten percent range. However, the rates from litigation appear, on average, to be higher than those negotiated outside of litigation. EXHIBIT 12.2 Royalty Rates: Litigation v. Non-Litigation Source: Navigant Consulting Patent Damages Database.
Litigation Rates are Higher

COMPARISON OF LITIGATED AND NON-LITIGATED LICENSES
