Land Use, Maintenance and Protection to Ensure ES
Fig. 6.1
Scheme of overlying terms and concepts in the human-environment-sector. © Grunewald
Science and politics need to ensure that the practical part will be supported: What is actually meant, which interactions are relevant, what is important? For example, the National Committee for Global Change Research (NKGCF 2011) demands good practise definition of regionally specific indicators and monitoring strategies , including the comparison of measurable variables of biodiversity, functions and services of ecosystems, land-use and socio-economic trends, or “development and verification of models and concepts in sustainability research with a view to biodiversity and ecosystem services” (ES). As a result high research policy expectations are aroused in a complicated, integrated area. It is possible that different target systems, e.g. of agriculture and protection of species, might show different behaviour. Therefore, fundamentals need to be developed to negotiate considerations (◉ Fig. 6.1).
Sustainable land management and landscape conservation are crucial factors of our basis of life. That’ is why we focused on ES case studies concerning the subject land use/land-use changes as well as protection and maintenance of landscapes.
The land surface represents the primary human habit at which mankind has influenced and actively created for centuries. Recent developments of global changes like demographic change, climate change plus globalization of economic systems constitute enormous challenges with this limited resource to treat. Besides the area of nutrition this also concerns the supply of energy and habitat or preservation of ecosystems.
Predominantly land use and driving forces of land-use changes constitute a socio-economic category. Humans as acting entity of interventions in nature are set to land utilization (Ott 2010). This implies it is not about whether but how the intervention into ecosystems is made and how certain interventions can be evaluated. The ES concept shall and can help to understand contexts. Again references to biodiversity are relevant, especially within the German National Strategy on Biodiversity (BMU 2007) and within the Federal Biological Diversity Programme (BMU 2011).
Drawbacks in the natural environment like loss of animal and plant species, penetration of Neobiota, enhanced pollutant concentrations in soils, water and air, soil erosion, sealing and fragmentation of natural habitats, loss and damage of landscape elements or increasing noise because of traffic routes is mostly due to cause of land uses of humans. For decades these ecosystem changes are subject of environmental research discussions, but to what extent are they influencing utilization, user and the human well-being? Even if objective facts of land use are analysed, systematised and represented according to scientific categories (biophysical methods, ▶ Sect. 4.1), troubleshootings and decisions are taking place in public discourse. In this specific aspect the integrative ES concept is said to help and enable innovative realizations (▶ Sect. 4.5).
In democratic countries like Germany, land use or cause of potential abuses (see above) are controlled on the basis of rules of what they should and should not do. The legislation can be considered extremely great in the EU and Germany. Tedious social negotiation processes are normally preceded to legal regulations . These assume ecological analysis as well as perception and estimation of the risks or the hazards for humans and environment (= constructivistical social process). Condition for adequate social trade is the timely recognition of land-use problems but it is not a guarantee for ‘right’ responses.
Integrative management which in addition is made to contribute a balance between objectives of protection, sustainable use and equitable sharing of gains derived by use, is the matter of the interface ES–land use (Jessel 2011). Mankind is considered an explicit part of ecosystems (landscape approach, ▶ Sect. 3.4). This corresponds to the principles of the ecosystem approach of the Convention on Biological Diversity (CBD 2010), the so-called Malawi-Principles (Häusler and Scherer-Lorenzen 2002).
The objective target, which is linked to case studies presented hereafter, is mainly consistent of:
1.
Demonstration of multifaceted applications of the ES concept : terms, categories, approaches of analysis and assessment, cost-benefits considerations, mechanisms for controlling and finance (aspects of methodology)
2.
Presentation of possibilities, how ES approaches could contribute to sustainable land use (new way of looking at concepts, design options , possibilities and limits of the concept)
3.
Discussion of the current status of ES capturing in Germany (regional and ecosystem-/land-use type specific aspects).
The different professional backgrounds of the case study authors caused various perspectives and emphases. Articles had to be kept as short as possible so that individual problems could not be presented explicitly and in a detailed manner. In accordance to settings of priorities on land use and ecosystem types the case studies have initially been classified to areas of the main land cover categories in Germany (agrarian, forestry and urban ecosystems) . Marine, coastal and high mountain ecosystems were left aside. All ecosystems are representing a production, living and regeneration space although with different emphases so, in principle, all three categories are relevant in ES.
Wherever humans need to intervene in nature to protect their own existence, a target-orientated landscape management is necessary for the preservation of values and services of ecosystems. The necessary expenses are describing a minimum-indicator for the valuation of ecosystems, because their existence is not secured without these accomplishments. Such analyses are focused in the landscape management (Landschaftspflege) accounting evaluations (▶ Sect. 6.5). Completing specific aspects of nature conservation, soil-, water-, and flood protection as well as climate- and peat protection will be discussed. Thereby, aspects of hemeroby, structural characteristics but also processes and matter balances are figured.
Furthermore, the case studies have been selected according to the following criteria:
ES are assessed in projects and the results have been discussed in public (‘wealth of existing data’).
Representation and transferability: ES were processed on a regional basis, they are typical, verified and validated (‘exemplary representation’).
◉ Figure 6.2 illustrates the location of the case studies, which are mainly situated in Central and East Germany (states Saxony and Mecklenburg-Western Pomerania/Brandenburg, urban area of Leipzig, county Goerlitz, Ore Mountains, Mulde-Loesshuegelland, floodplain and catchment area Elbe). In ▶ Chap. 3, 4 and 5 individual cases of methods and techniques with regional examples have already been visualised (◉ Fig. 6.2).
Fig. 6.2
Spatial location of the case studies. The number below refers to the section which is worked on. © IÖR/Grunewald und Witschas
6.2 Assessment of Selected Services of Agro-Ecosystems
6.2.1 Introduction
O. Bastian3
(3)
Leibniz-Institut für ökologische Raumentwicklung, Weberplatz 1, 01217 Dresden, Germany
Utilised agricultural areas are currently taking up about half of the territory of the EU. Over many centuries, due to ongoing development created by humans, these agro-ecosystems have been and are partly still treasured for their biological variety and as producers of diverse ES. However, the continuous and ever-increasing intensification of agricultural production in favourable areas (land consolidation, large-scale application economy, mechanization, chemical-based approach) plus the mission and reforestation in disadvantaged regions has resulted in serious decline of biodiversity and many regulating and (socio)cultural ES over decades–a process which is expected to continue .
To give the farmers and to spread public understanding of the biological diversity, as well as the positive effects and achievements coming from numerous gentle cultivated agricultural lands , the implementation of the ES concept is suggestive for a number of reasons (Plieninger and Schleyer 2010):
No other ecosystem has been as well researched in how management measures may influence ES (e.g. reduction of the input of fertilisers and pesticides into surface waters through growing of woods in the agro-culture).
Many ES are placed as paddock jointly with agro-products; in few cases entire waiver on agricultural production is required to support ES.
In the European agriculture significant experiences with economic incentive instruments , which can specifically be targeted as supply for ES, are already available.
Many agro-ecosystems are disposed of high potential to strengthen ES. Agriculture relies highly on ES (regulation capacities), otherwise it provides efforts in significantly extents (provision performances). The community might impose external costs according to cultivation management in terms of habitat losses, nutrient translocations or greenhouse gas emissions.
Still, it should be noted that the ES term is not very common in the European agricultural policy so far.
In the following sections three case studies on ES or comparable issues in the area of agriculture will be presented:
3.
The identification of ES in extensively used grassland rich in species (so-called High Nature Value-Farmland, HNV; ▶ Sect. 6.2.4)
6.2.2 Agri-Environmental Measures: The AEMBAC Methodology
O. Bastian4
(4)
Leibniz-Institut für ökologische Raumentwicklung, Weberplatz 1, 01217 Dresden, Germany
To maintain or enhance biodiversity, ES and sustainability of agro-ecosystems , the European Union provides incentives for environmentally friendly farming. The Common Agricultural Policy of the EU (CAP) consists of two main pillars: Pillar 1 includes direct payments to the farmers (to support their income under the condition that they respect minimum requirements of environmental compatibility, so-called Cross-Compliance rules). Pillar 2 aims to improve the competitiveness of agriculture and forestry, biodiversity, environment and landscape, and the living conditions in rural areas.
Payment mechanisms are set into force, so-called Payments for Ecosystem Services (PES), for which well-defined services are performed (directly or indirectly) on a voluntary basis against paying a defined monetary amount .
Agri-environmental programmes include a wide range of measures to improve the ecological situation in agricultural areas and, finally, the maintenance and enhancement of biodiversity and ES. For example, the conservation soil tillage shall reduce soil erosion, and the use of meadows according to nature conservation viewpoints shall maintain and increase the diversity of species in grassland ecosystems. As Plieninger and Schleyer (2010) argue, however, the specific ES to be delivered are mostly not defined clearly.
Fig. 6.3
Working steps of the AEMBAC methodology on the example of test sites in Saxony
Apart from the fact that agri-environmental programmes hardly refer to ES, their reference to landscape units is also poor, i.e. the regional peculiarities and requirements are not taken into consideration enough. To overcome such deficits, the AEMBAC methodology provides a promising approach that was developed in the framework of an EU-project and tested in several European countries, including Germany (AEMBAC = Definition of a common European framework for the development of local agri-environmental programmes for biodiversity and landscape conservation) (Bastian et al. 2003, 2005, 2007; Lütz et al. 2006).
The consideration of regional/local peculiarities or the character of an area and the consideration of existing ecosystem properties , potentials and functions (or ES) belongs to the key points of the AEMBAC methodology. It can be divided into three phases (◉ Fig. 6.3):
Phase I: Assessment of the ecological capacity of the agricultural landscape based on various landscape functions (or ES, with the main areas of focus ‘biodiversity’, ‘scenery’, ‘soils’, ‘waters’), analysis of positive and negative environmental impacts and assessment of the ecological sustainability of the current agricultural production in the study areas
Phase II: Identification of local agri-environmental measures
Phase III: Agreement of the suggestions with farmers and authorities
6.2.2.1 Agricultural Areas (Arable Fields and Grassland)
have also other tasks in addition to their main task, the production of food and raw materials (provisioning ES). They contribute to the provision of drinking water through groundwater recharge, they provide habitats for wild plant and animal species of unwooded areas, and they shape the character of landscapes. In short, they supply a large number of provision, regulation and socio-cultural ES. The management of agricultural lands has to avoid the one-sided orientation towards maximum yields but on the costs of other ES. The “normal” level of these demands is prescribed by the “good agricultural practice”. If the farmer provides services going beyond this “normal” level, he can make claims to compensation for reduced yields and income losses. These claims against society are justified as society benefits from the ES. Society can stimulate farmers by financial means that they voluntarily meet higher requirements of nature conservation. This is done by means of agri-environmental measures or whole programs .
6.2.2.2 Phase I Includes the Following Steps:
1.

Identification of important ecosystem services (or landscape functions) and suitable indicators based on the Pressure-State-Response-Model of the OECD (Eckert et al. 2000). State indicators describe the state of the environment (e.g. species diversity, water quality; ◉ Fig. 6.4 and ◉ Table 6.1). By comparing targets that are given or have to be specified for the specific situation, the state of the environment can be assessed (◉ Table 6.2). Pressure indicators address risks for the environment and the reasons for them (e.g. N-balance, application of fertilisers and biocides, nitrate loads of groundwater, disposition for erosion, crop diversity, size of field-plots, crop rotation, methods of livestock breeding). Response indicators address the consequences society and politics are ready to bear to improve the given situation .
Fig. 6.4
Ecological impact matrix: comparison of pressure and state indicators (or landscape functions/ES) and assessment of sustainability
Table 6.1
Blending single action recommendations to a multifunctional package of actions in the study area “Jahna” (Central Saxonian Loess Area; Agreement of measures for several state indicators, avoiding reduncancies)
Measures | Quantity (ha) | ||
|---|---|---|---|
Bufferung through grassland stripes: Near-natural, valuable floodplains Near-natural, wooded wet biotope complexes Existing wood structures incl. orchards | 265 | ||
Establishment and management of orchards on arable fields | 580 | ||
Establishment of linear or areal woods in accordance with the potential natural vegetation | 1000 | ||
Conversion of arable land to extensively used permanent grassland in floodplains and on arable land (hollows) endangered by erosion | 3500 | ||
Establishment of permanent field margins (without plant protection, N-fertilisers, and with wider plant spacing) | 250 | ||
Introduction of organic farming | 2000 | ||
Conservation soil cultivation (including 1000 ha organic farming) | 6500 | ||
Reduction of fertiliser impacts per area (further investigation on current and desired state necessary) | – | ||
Comparison of current and desired state | |||
Area (ha) | Area (%) | ||
Arable land (status quo) | 19,770 | 100 | |
Arable land (target) | 14,425 | 73 | incl. 250 ha field margins, 2000 ha organic farming, 5500 ha conservation soil cultivation (assumption that in organic farming applies conservation soil cultivation) |
Grassland (status quo) | 1751 | 100 | |
Grassland (target) | 5516 | 315 | |
Conversion | 1570 | 8 % (of arable land) | Withdrawal of arable land from agricultural prodcution for the plantation of coppices and orchards |
Table 6.2
Ecological demands of the landscape plan for the rural municipality Promnitztal and their possible implementation by agricultural measures
Requirements of landscape plan | Modeled measures | |
|---|---|---|
Arable fields | General decrease of production intensity | Reduction of nitrogen fertilisers and biocides by 20 % |
Field margins | Establishment on all plots of land | No nitrogen fertilisers and biocides |
Buffer zones | Establishment around valuable biotopes (running waters, woods, wet areas) | Natural succession or planted woods on 50 % of all buffer areas, reduction of nitrogen fertilisers and biocides by 40 % on the remaining 50 % of buffer areas |
Protection of reptiles | Reduction of land use intensity at some places | Arable fields: reduction of nitrogen and biocide application by 40 % Grassland: development of rough grassland, renunciation of nitrogen and biocide application |
Grassland | General decrease of production intensity | Reduction of nitrogen and biocide application by 20 %, mowing pasture (two cuts + pasturing) |
Planting of woods | Development of hedges typical for the area as well as rich-structured forest edges | Calculation of income-losses due to land abandonment, consideration of positive influences of hedges on yields |
2.
Definition of Environmental Minimum Requirements (EMR) for selected indicators with respect to the maintenance of ecosystem functioning (including agro-ecosystems) to facilitate the definition of agri-environmental targets and measures. EMR are referring to the carrying capacity of a landscape.
An EMR is a single value (a threshold), a range, or a set of values of a state indicator that is assumed to be sufficient for the satisfactory performance of the landscape function analysed. If the actual value of a state indicator achieves its EMR, no impacts (either positive or negative) on the particular landscape function relating to this state indicator are detected. In this case (or, if the actual state is even better than the EMR), the specific land-use practice or measure responsible for this situation can be regarded as sustainable in relation to the particular state indicator or landscape function under consideration. One and the same EMR value of a state indicator can be applied for a specific ES for two or even more ES. EMR or environmental targets for agricultural landscapes are listed in literature (e.g. Breitschuh et al. 2000; Knickel et al. 2001). Several targets are also written into laws (e.g. nature conservation acts) and the different instruments of spatial planning (e.g. regional plans, land-use plans), mostly following a process of political consideration. The definition of local EMR should be oriented on specific–first ecologically justified–EMR tailored for the particular areas. The so-called good agricultural practice is not identical with EMR. The current good agricultural practice may well cause ecological damages and violate the principles of sustainability.
3.
Analysis and evaluation of (negative but also positive) environmental impacts caused by agriculture. It is interesting whether an agricultural system or a measure (in form of a pressure indicator) impairs one or several ES. Based on this analysis, priorities can be set towards negative/positive influences (from agricultural practices), which have to be curbed or encouraged urgently.
4.
Assessment of the carrying capacity of the agro-ecosystems /the landscape against agricultural activities and evaluation of their sustainability, based on the comparison (deficit analysis) between the current state (state and pressure indicators) and the EMR (◉ Fig. 6.4).
Statements about sustainability aim to assess whether the current land-use practices are long-term compatible for nature and society or whether alterations are necessary, e.g. by the implementation of agri-environmental measures . Sustainability in this context means the long-term maintenance of agricultural production (provisioning services) without hampering other ES of the agro-ecosystem or of adjacent ecosystems, i.e. production and the maintenance of the environment are not considered as contradictions. In agro-ecosystems, assessment standards that only consider the natural environment are equally questionable as such standards which only count the economic success. The comparison between the current state and Environmental Minimum Requirements reveals deficits, which should be remedied by agri-environmental measures. If the current state is in line with the EMR value, no measure is necessary .
6.2.2.3 Phase II Includes the Following Steps:
1.
Definition of local agri-environmental targets basing on minimum requirements (EMR from phase I) and socio-economic conditions in the study areas.
2.
Definition of the most suitable EMR to achieve these targets.
One should be aware, however, that it is possible to identify the need for action and the content of agri-environmental measures (AEM) leading to more sustainability in the agricultural landscape. A scientifically valid quantification of the extent of an AEM for a specific area, however, seems to be almost impossible. Therefore, it seems appropriate to define grey areas and safety margins, which have to operate without secured knowledge, if–from a nature conservation point of view–with sufficient probability inacceptable impairments may be expected after the limit zone is reached or surpassed (precautionary principle) (Dröschmeister 1998). Priority should be given to such measures, which counteract especially serious environmental loads, while improving several ES (e.g. increasing biological diversity + the aesthetic value of the landscape), and remaining financially feasible. An intelligent selection of AEM (e.g. the plantation of hedgerows) may influence several indicators or ES positively at the same time. The definition of specific AEM (disclosed separately according to single indicators or ES) may also lead to redundancies, partly even to an oversized claiming of agricultural area for nature conservation and landscape management. Therefore, it is important to blend the single proposals to a package of action purged from redundancies. These measures have to be located within the study areas (◉ Table 6.1). An action plan results from this, which, first, incorporates only environmental considerations. It is an intermediate step, which has to be evaluated in monetary terms during a following working step (phase III) and which is provided to the farmers and other stakeholders to check their acceptance .
3.
Proposition of legal and/or economic stimuli: Assessing the applicability of economic (market-oriented), legal and controlling tools as incentives for farmers to maintain environmental goods and to give up unsustainable agricultural practices.
6.2.2.4 Phase III Includes the Following Tasks:
1.
Analysis of the acceptance and feasibility of the proposed agri-environmental measures (AEM) by farmers and authorities
2.
Calculation of the costs for the authorities (implementation of agri-environmental programmes) and farmers (economic aspects, gross margins)
3.
Overall evaluation of all economic or financial aspects of the implementation of AEM.
Through interviews with farmers and authorities measures are identified, which may contribute especially effectively to improving the state of the environment. Obstacles are revealed, and–if necessary–corrections or alternatives for certain measures are identified (participatory approach) . Checklists serve to assess the economic efficiency and applicability of the suggested measures.
Conclusion
The AEMBAC methodology is in general suitable to analyse agri-environmental problems comprehensively, to link ecological and socio-economic aspects by referring to environmental functions or ES, and to show and strengthen the relation between the natural environment and human well-being . The approach may contribute to maintain the diversity of rural regions and to support the competitiveness of agriculture against the background of the increasing liberalization and globalization of agricultural markets . Although AMEBAC was developed for agricultural areas, in principle it can also be applied to other economic branches, e.g. to forestry and fishery.
6.2.3 Agro-economic Evaluation of Landscape Plans
O. Bastian5
(5)
Leibniz-Institut für ökologische Raumentwicklung, Weberplatz 1, 01217 Dresden, Germany
For the implementation of proposed agri-environmental or nature conservation measures it is necessary to determine the costs and to reach a consensus between the involved stakeholders .
For the integration of nature conservation objectives into land use, the instrument of landscape planning can be used. As the guiding planning of space-related environmental protection, landscape planning pools the various specific activities and specialist contributions of environmental protection and nature conservation . The present practical implementation of landscape plans in rural regions, however, cannot satisfy (▶ Sect. 5.3). One point of criticism is that proposed measures are often reasoned only from a nature conservation point of view without taking the interests and economic capacities of land users into account (Geisler 1995; Marschall 1998) .
Thus, it may be useful to underpin landscape plans (and protected areas concepts) by economic evaluations . In the following section, an investigation on the example of the (former) rural community Promnitztal (State of Saxony, Germany) will be presented, to which extent the nature conservation objectives and stipulations of a landscape plan are realistic, i.e. if and under which preconditions the agricultural enterprises would be able to meet the demands.
For this purpose, an agro-economic evaluation of the measures laid down in the landscape plan was performed. Taking the economic frame conditions into consideration, and basing on the landscape plan, concepts for a nature-compatible and economically sustainable land use were elaborated. It was shown that the integration of nature conservation objectives into the agricultural production may be reasonable also from an economic point of view (Lütz and Bastian 2000, 2002).
The project area, the former rural community Promnitztal–independent until 31 December 1998, now part of the small town Radeburg–is immediately north and adjacent to the Saxon state capital Dresden and covers c. 2085 ha. The territory of Promnitztal is almost totally protected (landscape protection area ‘Moritzburg small-hill landscape’) and belongs–from a physical-geographical point of view–to the Western Lusatian Hills and Low Mountain Range. The ‘Moritzburg small-hill landscape’ is characterised by a small-scale pattern of small hills and low ridges with exposed rocks and flat hollows. The bedrock is dominated by monzonits, but granodiorite, sandy and holocene substrates also occur. The basic geomorphological pattern causes a high diversity of soil, water and climatic conditions which is responsible for the present vegetation cover and land use. Effective agricultural production is hampered by complicated natural site conditions. Forests and woods are concentrated on the crests of the rocky and stony hills, arable fields on slopes and grassland in moist hollows. Land improvements (especially drainage) have tried to diminish this natural heterogeneity but with little success. Drainage facilities fell into disrepair after a few years, and the thin soil cover on the hills is an insuperable obstacle for ploughing. The result is a rich-structured rural landscape with a notably high biodiversity and interesting scenery . The area is particularly rich in species which are adapted to less intensive agriculture, e.g. rare arable weeds, plants of field margins, edges and small coppices, birds breeding in hedges, woods, grassland and arable fields; amphibians, reptiles and many insect species (Neef 1962; Mannsfeld 1972; Bastian and Schrack 1997; Schrack 2008) .
During the investigation period (1999) six full-time and four part-time farmers had fields within the study area. Mainly market crops and fodder plants (for milk production) were cultivated. The proportion of crops between 1996 and 1998 was as follows: 55 % cereals (winter rye, winter wheat, winter barley, oats), 20 % oilseeds (sunflowers, rape, flax) and 25 % field-fodder plants (maize). The proportion and pattern of crops were determined by natural conditions, variations in crop rotations, the need for animal food, and environmental restrictions through the programme “Agriculture harmless to the environment” of the Federal State of Saxony. The latter compensates for environmental measures in the cultural landscape, financial compensations for economically deprived areas, subsidies and actual market prices . The predominating crop rotations in the 1990s were as follows: winter wheat–winter barley–rape–winter rye or maize on soils better provided with water and nutrients; winter rape or maize–cereals (no wheat) on hills and near cowsheds .
Methods
To evaluate the effects of the nature conservation measures proposed or demanded by the landscape plan, a business management analysis in selected enterprises was carried out (◉ Fig. 6.5). The standard variable margin (= gross margin) per hectare was used as the basis for the evaluation of arable crops. This was done by comparing the inputs and the outputs of each production method. Thus, the variable margin is: Agricultural yield (sum of market prices, subsidies from the EU including agri-environmental incentives , and compensations for deprived areas), less costs of production (seeds, fertilisers, biocides, costs for machines and human labour). The variable margin was established for each crop for three consecutive years (between 1995 and 1998) and generalised to the average variable margin per hectare over the 3 years. The evaluation for grassland and maize was not carried out in monetary terms as for the arable crops, but with the method of fodder supply of metabolizable energy (‘net-energy lactation’).
Fig. 6.5
Steps of economic evaluation of the landscape plan
The demands and restrictions of the existing landscape plan (◉ Table 6.2) were incorporated into the variable margins and fodder evaluations. The consequences of the landscape plan implementation were expressed by the difference from the initial situation. The losses in yields were calculated according to Zeddies et al. (1997; the production function), and by comparisons with data from literature (e.g. Diercks and Heitefuß 1990; Mährlein 1993).
A constraint assumption in the study was that the sum of energy supply from the basic fodder areas (maize, grassland) should stay constant, i.e. the stock of cattle and the milk production should not be affected by these measures. To compensate the reduced yields, the increase of maize fields was assumed (3x higher fodder production than on grassland). Agricultural subsidies were considered as well (◉ Table 6.3) .
Table 6.3
Economic effects of the demands set up in the landscape plan Promnitztal
Measures area (ha) | Benefit/loss (€ ha−1) | Share of the variable margin (%) | |
|---|---|---|---|
Arable fields (without maize) (N-fertiliser and biocide reduction by 20 %) | 373.9 | − 3.9 | − 0.2 |
Buffer zones and “reptile protection area” (1.4 ha) (N-fertiliser and biocide reduction by 40 %) | 17,1 (21 km × 18 m) | − 18.3 | − 3.5 |
Field margin (without maize plots) (total renunciation of N-fertilisers and biocides) | 81,7 (45 km × 18 m) | + 389.7 | + 74.2 |
Average variable margin of arable fields | – | + 104.3 | + 20.0 |
Losses of area Direct losses: 49.7 ha Reduction of intensity (indirect losses): 69.1 ha | – | − 130.9 | – |
Average total variable margin | – | − 27.1 | − 5.0 |
Economic Evaluation of the Landscape Plan
The application of all the proposed measures led to an increase of the variable margin on arable fields. The reason for this was the high level of compensation payments provided for arable field margins (strips at the margins of arable fields which are not treated with chemicals to favour the development of a rich community of arable weeds). The average variable margin of arable fields increased in this model from 104 €/ha (20 %) up to 629 €/ha (◉ Table 6.3).
These positive influences on the variable margin, however, were balanced by other demands of the landscape plan: creation of hedges, forests and forest edges, areas for natural successions, buffer zones, grassland and revitalization of waters. To compensate for the measures of extensification (especially, the reduction of utilization intensity) 69 ha of arable fields were needed for additional field-fodder cultivation (maize). The effect of splitting these area losses on the variable margin was an annual monetary loss of 59,465 € totally or 131 €/ha of remaining arable fields. The average variable margin, therefore, decreased by 26 €/ha (5 %) to 498 €/ha.
The calculations showed that an almost income neutral realization of the landscape plan was possible (◉ Table 6.4). In order to compensate for financial losses (which are not acceptable from the farmers’ point of view), it was necessary to reduce the 49.7 ha of land removed from agricultural production in favour of hedges and other ecological measures as proposed in the landscape plan to only 45.1 ha. This means that by this calculation 5.8 % of the agricultural area could be withdrawn from cultivation without negative influences on the income of the farmers. This fact contradicted the usually poor perception of landscape plans (not only) among farmers.
Table 6.4
Economic evaluation of the measures (selection)
Measure | Evaluation parameters | Gain/loss (€) |
|---|---|---|
Intercropping and undersown crops | Subsidies and nitrogen saving—Costs of the measures – Autumn catch crops – Winter catch crops – Undersown crops | + 61 bis + 82 −31 bis + 37 + 5 bis + 26 |
Less application of of N-fertilisers in farming | Subsidies and nitrogen saving—Changes in yields | + 8 |
Field margins | Subsidies and nitrogen saving—Changes in yields – normal sowing density – reduced sowing density | + 383 + 547 |
Fallow-land | Subsidies—gross margin – temporal set-aside – permanent set-aside | − 97 Gain on poor sites |
Grassland | Subsidies and cost saving—Loss of arable land for fodder cultivation – No use of synthetic N-fertilisers – extensive pasture – extensive meadow | − 26 + 41 + 56 |
Plantation of hedgerows | Losses in arable land—higher yields by wind-breaks – yearly effect per 100 m hedge (width: 10 m) | −46 |
The Acceptance of the Farmers
The resulting new management concept was presented as a whole to farm-managers for examination, and the acceptability of the proposed measures was ascertained. The attitude of farmers to the proposed concepts was not based only on economic aspects. Of course, their receptiveness was greater for such measures when compensating programmes supported them. If agricultural land was demanded irreversibly (e.g. for woods), the farmers’ attitude was less favourable.
Conclusion
The existing incentives of the agri-environmental programmes can be regarded as the reason for the positive economic balance. As in the period of investigation the farmers did not use all incentives consequently despite potential income gains; there was a favourable constellation for the assessment of the landscape plan in terms of its economic feasibility. Thus, agri-environmental programmes may be effective mechanisms to integrate objectives of nature conservation/environmental protection into the agricultural land management, because farmers receive compensation payments from society for income losses caused by an increased supply of (regulation and sociocultural) ES.
Supported by stated subsidies, deprived agricultural regions may maintain nature-compatible agriculture. This is all the more important as such areas are often very valuable for nature conservation. Farmers, however, are less willing to participate in agri-environmental programmes and to manage their land in the sense of multifunctionality and ES, the higher the chances of income generation from market crops (fertile soils) and/or higher demands, e.g. through the boom of energy crops , if–at the same time–the financial allocation of the environmental programmes stagnate or decrease.
Only the monetary evaluation of the measures and the following discussion with the farmers enabled the implementation of selected measures by better participation in agri-environmental programmes. Although subjective reasons played a role in the decisions of farmers, they assessed the proposed measures mainly from an economic perspective.
The growing interest of society in multifunctional and ecologically intact (agricultural) landscapes should extend the spectrum of tasks and the responsibility of land users in future significantly (Vos and Meekes 1999). In view of the partially low ecological efficiency, the high administration expense and the low allocation of financial means in the existing subsidy programmes, the financial means should be moved to defined benefit plans for environmental protection in agriculture (Bronner et al. 1997). Conversely, environmental damages caused by land-use practices, which are not in line with the professional standards , should lead more to monetary consequences for those who cause the damages (Simoncini 1998). Finally, land-use forms, in which the maintenance of ecosystems and their manifold services and sustainable, resource-economical production are an inherent part should be identified.
6.2.4 Species-Rich Grassland Services
M. Reutter6 and B. Matzdorf6
(6)
Inst. für Sozioökonomie, Leibniz-Zentrum für Agrarlandschaftsforschung (ZALF) e.V., Eberswalder Straße 84, 15374 Müncheberg, Germany
6.2.4.1 Introduction
Internationally, the stated objective is to halt the loss in biodiversity (European Commission 2011). One of the consequences for agricultural landscapes is that species linked to agricultural use that are typical for European cultivated landscapes are to be maintained (BMU 2007). Species-rich grassland plays a crucial role in this context (EEA 2004; BfN 2008; BMU 2010a). According to the latest status review of high nature value (HNV) farmland, species-rich grassland accounts for some 16.8 % of the total grassland area in Germany (BfN 2010), corresponding to an area of approximately 1 million hectares (with regard to ATKIS, data basis for the status review) or 0.8 million hectares (as regards the statistical data) (◉ Fig. 6.6 and 6.7). Based on the definition in the context of HNV mapping , species-rich grasslands are extensively used grassland expressions that are particularly species-rich by regional standards (BfN 2008). The abundance of species is identified via indicator species in terrestrial mapping. This type of identification is already used in a number of federal states (Briemle and Oppermann 2003; Keienburg et al. 2006; Matzdorf et al. 2008). The method was primarily devised for mesophilic, moist and moderately dry grassland; in this way, all species-rich grassland areas and those that are valuable from a nature conservation perspective are captured together with FFH habitat types (BfN 2009).
Fig. 6.6
Grassland (green) in Germany (authors’ design, data basis CORINE 2000)

◉ Figure 6.7 shows the distribution of species-rich grassland in Germany as a result of HNV mapping. The spatial basis of the survey is site-specific space structuring (BfN 2004). The percentages determined range from 5 to 30 % within the spatial units. In this connection, regions rich in grassland are not always those with a high proportion of species-rich grassland. The relatively small proportions in grassland-rich regions in the northern part of Lower Saxony and in the foothills of the Alps are striking in this respect. The uplands of southern and central Germany exhibit particularly high proportions.
Irrespective of the current proportion of valuable grassland , the aim in all regions is at least to maintain it. Ultimately, however, the goal is not only to preserve species diversity of the agricultural landscape, but to achieve a trend reversal. One of the measures that seeks to achieve this is to increase the total percentage of HNV farmland from the current level of 13 to 19 % (BMU 2010a). Against this backdrop, it is also interesting to address potential synergies with regard to other environmental objectives, not least to provide arguments in favour of maintaining biodiversity in connection with the financial resources required to this end.
The aim of the following article is to highlight the services provided by HNV grassland areas to human beings. In particular, the monetary assessment of individual services is explored. If the concept of ES is applied in the case of cultivated landscape, account must be taken of the fact that many such services are not merely ES. It goes without saying that ecosystem processes are necessary for the species diversity of grassland , in addition to human services. In Germany, grassland is predominantly not a pure ‘natural product’–it only arises and exists on account of the human impact on natural, ecosystem processes.
6.2.4.2 Selection of Services and Assessment Approach
The following two criteria were taken into consideration in the selection of services: which services are produced by species-rich grassland, and for which services there is a specific demand.
In accordance with the Methodological Convention of the Federal Environment Agency, agreed targets are an expression of a socio-political preference (UBA 2007), and hence an expression of such a demand. We regard the implementation of the Water Framework Directive and the implementation of the Kyoto Protocol to be two key socially and economically relevant target agreements. Agricultural use plays a role in both cases (BMU 2010b; UBA 2011). Social relevance is highlighted by the fact that “improving the status of groundwater and surface waters” and ‘climate change’ are considered important challenges besides the objective of maintaining and developing biodiversity when it comes to the allocation of financial resources from the second pillar of agricultural policy (The Council of the European Union 2009). These objectives are ideal for highlighting synergies generated by the preservation of species-rich grassland .
If one assumes, given the current pressure on agricultural land (Lind et al. 2008; Nitsch et al. 2012), that species-rich areas would possibly be used as intensive grassland or arable land if no additional protective measures were taken, then this would be likely to result in a potential increase in water- and climate-relevant emissions, based on the current state of knowledge (Kühbauch 1995; Kersebaum et al. 2006; Osterburg et al. 2007; UBA 2010). This can have a negative impact on achieving the objectives mentioned above; conversely, the preservation of species-rich areas can have a positive effect. Owing to the current high level of importance of these potential services, these two ES (‘groundwater protection’ and ‘climate protection’) were selected with the aim of determining their value below.
Note that these services can only be recorded if a more intensive land use is assumed for reference purposes. The assumption that all species-rich grassland would be intensively used or converted into arable land does not appear to be realistic under the present conditions. In the context of this analysis, therefore, a more conservative scenario was taken as an example in which it was assumed that around 50 % of species-rich grassland would be used as more intensive grassland and some 5 % would be converted into arable land. On the basis of information available about the spatial distribution of HNV grassland, a total of approximately 1 million hectares was specified.
The economic value of the climate-relevant emissions that could potentially be avoided is balanced on the basis of damage costs and set as opportunity costs and market values in the comparison with avoidance costs. An avoidance cost approach was chosen as the method used to quantify the services for groundwater. Whilst climate-relevant emissions involve the avoidance of any emissions regardless of the geography, the demand for avoiding emissions under the Water Framework Directive is dependent on the specific location of the areas. With regard to the implementation of the Water Framework Directive, social preference only exists, strictly speaking, in areas in which the emissions generated would endanger the good status of water bodies.
The physical supply (potential or capacity) determined in the first step serves as the basis for the economic assessment . The materials and methods used are explained in further detail in the respective sections below.
6.2.4.3 Quantifying Emissions Reduced due to Species-Rich Grassland
Contribution to the Protection of Groundwater Bodies
Capacity of Areas
Within the context of the Water Framework Directive, measures are to be taken in virtually all coordination areas in Germany to reduce diffuse inputs of substances for groundwater bodies (BMU 2010b). The results generated by Osterburg et al. (2007) are built upon in order to assess the service provided by species-rich grassland . These authors assessed different agriculturally relevant measures in terms of their potential for reducing nitrate in groundwater against the backdrop of the Water Framework Directive. Variabilities for the impact of extensive use, typical for species-rich grassland, were assessed at the level of Germany compared to intensive use or the impact of converting arable land to grassland. We use these values below to demonstrate the capacity of species-rich grassland for groundwater protection .
According to Osterburg et al. (2007), extensive use reduces the nitrogen load in the leachate by 0 to 20 kg ha−1 compared to intensive use. Abstaining from sward renovation with ploughing up and resowing, which would be necessary to maintain species-rich grassland , increases the value by 40 to 80 kg ha−1. Compared to use as arable land , it is assessed that extensive grassland use decreases this value by 30 to 70 kg ha−1.
If one assumes, based on these figures, that some 50 % of the estimated extent of species-rich grassland is intensively used and a further 5 % would be converted into arable land, then up to 13,500 t of additional nitrogen load could occur annually in the leachate or 40,000 additional tonnes for sward renovation associated with intensive grassland use.
Economic Value
Costs would be incurred if the additional emissions of 13,500 t of nitrogen in the leachate would have to be saved elsewhere. If, in turn, one assumes the range of measures described in Osterburg et al. (2007) is taken, it would make sense to grow catch crops with relatively good cost-effectiveness. Depending on the cost-effectiveness relation, costs of € 10.8 million (cost-effectiveness relation: 50 kg N per € 40) or costs of € 64.8 million (cost-effectiveness relation: 25 kg N per € 120) are yielded for the avoidance of 13,500 t of nitrogen. ◉ Table 6.5 shows that the preservation of extensive grassland use can by all means constitute a cost-effective avoidance of emissions, depending on the concrete situation .
Table 6.5
The impact and costs of an alternative land use of species-rich grassland as well as an alternative measure to reduce the nitrogen load in the leachate. Data source: Osterburg et al. 2007
Impact and costs compared to extensive grassland use | ||||
Additional kg N ha−1 | Costs in € ha−1 | |||
Alternative land use | min. | max. | min. | max. |
Intensive grassland use | 0 | 20 | 80 | 150 |
Sward renovation | 40 | 80 | 20 | 50 |
Use as arable land | 30 | 70 | 370 | 600 |
Alternative for reducing the nitrogen load from utilised agriculture areas | ||||
Reduction in kg N ha−1 | Costs in € ha−1 | |||
min. | max. | min. | max. | |
Catch crops as winter greening as opposed to winter fallow | 25 | 50 | 40 | 120 |
The avoidance costs are particularly important in regions where contaminated groundwater bodies already exist. ◉ Figure 6.8 designates the chemical status of groundwater bodies in Germany, and shows where excessive levels of contamination already exist. It must be said, however, that the illustration is an overall assessment that does not explicitly reveal the necessity of a reduced nitrogen load in the leachate. No further correction of the values calculated above is undertaken.
Fig. 6.8
Chemical status of groundwater bodies in Germany (the red areas indicate poor status). Source: BMU 2010b
If, however, nitrogen emissions are too high at present and mitigation measures are already necessary, then the prevention measures calculated above under the assumption of the lowest costs may under certain circumstances be considerably more expensive. Maintaining species-rich areas therefore becomes increasingly more profitable.
In summary, the value of species-rich grassland for water quality must be determined with full knowledge of the location and characteristics of areas, the load situation and other development objectives. However, the values show how important species-rich grassland is in implementing the Water Framework Directive (◉ Fig. 6.8).
Contribution to Climate Protection
Capacity of Areas
Below we use a simplified method of climate reporting (area of land-use change; UBA 2010), taking into account the current distribution of species-rich grassland, to show how much CO2 would be released if 5 % of such grassland was converted into arable land . The 5 % scenario was chosen because such ploughing up of grassland is permitted at the federal state level in the current CAP funding period. Federal states must only take action to prevent a further net loss if the 5 % level is exceeded .
Scientists are currently of the opinion that converting grassland into arable land leads to the release of CO2, and hence to the loss of organic carbon (UBA 2010). The quantity released is dependent not only on use, but also on site factors such as the soil type, hydromorphy, plants and climate. In this connection, moor soils have the highest carbon stocks . If management is changed from grassland to arable land , it is assumed, so far with great uncertainty, that the annual release increases from an estimated value of approximately 5 to 11 t ha−1 (UBA 2010); for mineral soils, a loss of 30.43 % of carbon stocks is assumed following the conversion of grassland into arable land.
The key data basis for the calculation was the general soil map for Germany (BÜK 1000), which combines different types of location into soil associations. Each soil association is described in a guiding profile. On the assumption that these guiding profiles are considered to be representative, the data given was used to calculate site-differentiated carbon stocks. The Corg contents were multiplied by the respective crude densities and horizon thicknesses, from which the skeleton fraction was then subtracted. Horizon stocks were added to a depth of up to 30 cm. In order to integrate the estimated value for moor soils mentioned above into the calculation, we used a period of 10 years. Carbon stocks were determined specifically for grassland areas by blending the general soil map with land-use data . Due to the high computational effort involved with ATKIS, the relation to land use was achieved using CORINE 2000.
◉ Figure 6.9 shows the area-weighted, average loss of organic carbon stocks resulting from the calculation in the event of a conversion from grassland to arable land within site-specific spatial units. If one assumes that species-rich grassland within site-specific units is distributed evenly across grassland occurrence, a conversion of 5 % respectively would release approximately 6 million tonnes of CO2.
Fig. 6.9
Average loss of organic carbon stocks Corg (t ha−1) in the conversion of grassland to arable land (authors’ calculation on the basis of site-specific space structuring by the Federal Agency for Nature Conservation (BfN); area-weighted mean calculated from blending BÜK 1000 with CORINE 2000)
It should be borne in mind that this is a simplified calculation method compared to the method involved in climate reporting. The result should be considered as an approximate value that nevertheless attempts to integrate the resulting highly decisive locational capacities. It is particularly difficult–but crucial–to identify moor locations. The German-wide general soil map is highly generalised. Emission levels and a better understanding of carbon stocks are currently being investigated scientifically in various projects. In particular the data basis and assumptions concerning release rates are to be improved further in connection with climate reporting (UBA 2010). On the other hand, there is a barrier because little specific location information exists for species-rich areas. The uniform distribution used within site-specific spatial units has not yet been verified. Consequently, the calculation was made based on the latest available information, but ought to be improved further (◉ Fig. 6.9).
Economic Value
If damage costs of € 70 per tonne of CO2 equivalent (CO2 eq.) published in the Methodological Convention of the Federal Environment Agency (UBA 2007) to estimate external environmental costs are assumed, then the calculated conversion of 5 % of regional species-rich grassland would entail costs of € 420 million. Owing to the major uncertainty about damage costs , the Federal Environment Agency recommends considering the potential range from € 20 to 280 per tonne of CO2 eq. The damage costs would then have a margin of uncertainty from € 120 to 1680 million.
Avoidance costs are set at € 20 per tonne of CO2 for hydro electric power plants, for example, and € 40 per tonne of CO2 for biomass power plants or wind turbines (Herminghaus 2012). If, however, the average prices of auctioning emission permits in Germany are assumed, then this is just under € 7 (DEHSt 2012). Hence the range of monetary value is very wide. For this reason, we renounce from the subsequent method of discounting . It would be more sensible to specify orders of magnitude.
Based on the initially specified average damage costs of € 70 per tonne of CO2 eq., an area-related, regional mean value between around € 6000 and 13,000 per hectare is yielded, without taking into account discounting (a sum that, in view of those of current premiums within the framework of agri-environment measures, for example, such as in the range mentioned above in ◉ Table 6.5, no longer appears to be particularly high). If the figure of € 7 specified above is assumed to be the “market value” , then area-related, regional mean values of around (only) € 650 and 1300 per hectare are yielded, without taking into account discounting .
In summary, the value of species-rich grassland for the climate is dependent to a great extent on its current level of stored organic carbon. In addition, it is also influenced in this case by the alternative possibilities and costs involved in compensating for the emission of climate-relevant gases or to ensure they are not increased by an alternative land use . In any case, the maintenance of species-rich grassland exhibits an undoubtedly interesting importance for the implementation of climate objectives, particularly since it arises as an add-on effect for water protection and biodiversity objectives.
6.2.4.4 Discussion and Outlook
Maintaining species-rich grassland is a declared objective of the national biodiversity strategy (BMU 2007). The social significance of this objective is also illustrated by the fact that of HNV-Farmland is an indicator in the context of allocating financial resources to promote rural development . The success of rural development programmes is therefore measured in terms of the maintenance of these areas, amongst other things (The Council of the European Union 2005).
The analyses demonstrate that economically relevant, environmental services in the area of climate and water-body protection are associated with the maintenance of species-rich grassland. The amount depends on the concrete local situation. Thereby the avoidance of additional emissions may be of particular economic importance in regions that already have an unfavourable status of water bodies. The avoidance of climate-relevant carbon emissions on these areas is in principle also economically relevant. It is essential that emissions are reduced further, which means avoiding additional emissions.
It must be borne in mind that the services considered cannot be offset equally for all species-rich grassland areas and the references assumed for balancing are crucial. In the context of this study, a scenario was applied that assumes that intensive grassland is used on around 50 % of the land and approximately 5 % of the land is converted. Particularly for ‘extreme locations’ that are very valuable from a nature conservation perspective, such as wet meadows, arid grassland or hillside locations, forestation and the formation of scrub constitute an alternative option, which may even be more realistic. If the current payment for species-rich grassland were abandoned, some areas would be taken out of use completely under the current framework conditions under certain circumstances, and scrub encroachment would occur leading to the successive development of woodlands. In case of this reference (succession), there are no synergies between the maintenance of species-rich grassland areas and environmental services in the area of climate and groundwater protection, because forest development is not assessed as negative for these environmental services, and may even be considered positive. Thus locational differences would have to be taken into greater account to achieve more precise balancing. It must also be borne in mind that the reference depends crucially on political and economic framework conditions. For example, sustained pressure on grassland areas due to the production of biomass can also lead to changed reference scenarios . Then greater proportions of more intensive use or the ploughing up of grassland than applied here would have to be assumed.
In everyday decision-making, for example involving funds to promote ecologically sound grassland use , it is therefore crucial to factor the original value of diversity into the equation. In this connection, a differentiation must be made between the direct value of biodiversity and the value that diverse habitats provide for tourism and recreation, for example. However, the direct value can only be estimated methodologically in economic terms as the so-called nonuse value via contingent valuation or stated preference methods (▶ Sect. 4.2). Great reservations are often harboured against these methods in Germany. Against this backdrop, it will continue to be necessary, particularly in the area of traditional nature protection, to include other forms of assessment as the foundation for decision-making. This could be possible in a monetary and verbally argumentative manner on the basis of nonuse values. Databases are available as guidance for Germany in the form of contingent valuation by Hampicke et al. (1991) and recent studies by the Federal Agency for Nature Conservation (BfN 2012c, Meyerhoff et al. 2012). With regard to methods, it must be noted with these studies that the calculated values by all means reproduce the nonuse value, as well as utility values for local recreation, for example. If one follows the argumentation that objectives enshrined in law are assessed as politically framed social preferences (UBA 2007), then reinstatement costs such as for the habitat types that constitute important target areas in the Habitats Directive, also requested by Schweppe-Kraft (2009), would also be legitimate from an economic perspective.
Conclusion
Species-rich grassland is not only important regarding biodiversity objectives. Avoiding the intensive use of grassland or conversions into arable land can support the objectives of implementing the Water Framework Directive and climate change mitigation targets. The potential involved depends on the specific local situation. Based on the calculation of avoidance costs, potential damage costs and willingness to pay , we demonstrated that species-rich grassland generates a range of considerable benefits. These monetary values can be included in the line of argument to support the desired maintenance of particularly species-rich grassland. In this connection, the ES concept encourages a holistic view of these areas that are valuable from a nature conservation perspective. With pro active use via a systematic, locationally differentiated assessment, it could be very useful as decision-making support for nature protection, particularly as part of targeted financial support, e.g. via agri-environment measures.
6.3 Economic Benefit Valuation of the Influence of a Forest Conversion Programme on Ecosystem Services in the Northeastern Lowlands of Germany
P. Elsasser7 and H. Englert7
(7)
von Thuenen Institute / OEF, Leuschnerstrasse 91, 21031 Hamburg, Germany
6.3.1 Introduction
Increasing the naturalness and the resilience of forests through ‘forest conversion’ is an important topic in German forestry for a number of reasons (Knoke et al. 2008). Many of today’s forests consist of rather uniformly structured conifer stands which may be easier to manage, but which feature low biodiversity rates and are often particularly damaged in disasters like storms, fire, and insects. Moreover, droughts are of growing concern, especially in the eastern part of the North German Plain which already suffers from low annual precipitation–a situation which might be even further aggravated due to climate change. Public as well as private forest enterprises aim to stabilise homogenously structured forests by investing in large forest conversion programmes which convert purely coniferous stands into mixed and broadleaved forests. These efforts are financially supported by subsidisation programmes at federal and at state level (BMELV 2011b). Arguments in favour of such forest conversion programmes are that they not only reduce risks through the diversification process, but also enhance the supply of ecological services like watershed and climate protection , biodiversity and recreation opportunities for the population (Fritz 2006).
This case study analyses the economic value of ES which is modified through a forest conversion programme in the northeastern lowlands of Germany. The background information used in this case study comes from the interdisciplinary research project ‘Newal-Net’, funded by the Federal Research Ministry between 2005 and 2009. The Newal-Net project involved silviculturists, climatologists, ecologists, cultural and education scientists, and economists as well as practitioners. Project partners and stakeholders developed an overall concept (‘leitbild’) of future landscape development for a region in northeastern Germany which is currently dominated by purely pine forests.
The region abuts Berlin to the north and extends 17,500 km2, encompassing about a third of the federal states of Brandenburg and Mecklenburg-West Pomerania. 30 % of the region is covered by forests. The ‘leitbild’ (called “climate adaptive deciduous mixed forest”) was discussed and further developed together with regional stakeholders . Following these discussions two scenarios for regional forest development, up until 2100, were modelled. Specifically the scenarios were
1.
A stepwise realisation of the ‘leitbild’ whenever a forest stand is harvested
2.
The continuation of the current forest management plans, i.e. ‘business as usual’ (‘bau’)
The ‘leitbild’ scenario was envisaged as a continuous reduction of the conifer area in the region, from an original 76 % in 2006 down to only 13 % in 2100 and correspondingly enhancing the area of mixed and deciduous forests up to 87 % in 2100. In the ‘bau’ scenario a reduction in conifer area was also planned, however at a much more conservative rate (from 76 % in 2006 to 67 % in 2100). In this scenario, the final share of mixed and deciduous forests is 23 % in 2100.
The goal of the project partners was to use this generated data from the scenario modelling to quantify and analyse, according their expertise, the impact of applying the ‘leitbild’ concept in practice and compare this to the ‘bau’ situation. The central question for the economists in the project is: Are there substantial changes in the range of services provided by the forest and their subsequent economic values and does this speak for or against implementing the concept of “climate adaptive deciduous mixed forest”? Thus, the focus was on the ‘benefits’ side of the problem, specifically on the impacts on regional timber and biomass supply, landscape values, recreational values, and carbon sequestration, rather than on the ‘cost’ side of forest conversion . The remainder of this chapter summarises the main results of the study (the description is partly based on Elsasser et al. (2010a); further details on methods, analyses and results can be found in Elsasser et al. (2010b).
6.3.1.1 Raw Wood Production
The production of raw wood as a “provisioning ecosystem service” (MEA 2003) is the basic source of income for most forest enterprises . Methodologically, the valuation of raw wood production was based on forest development and forest utilisation models in combination with price data derived from market observations. Note, a similar approach was used for valuing the carbon sequestration service in the next chapter. To simulate forest development until the year 2100 we used forest growth models based on yield tables, which include assumptions about forest management planning. The results from the scenarios revealed different development outcomes. These results are primarily dependent on the specific tree species compositions in the respective scenarios. Our estimates of the expected raw wood revenues were based on forest condition descriptions, which are derived from the forest growth models in the reference years 2006, 2020, 2040, 2060, 2080 and 2100. Starting from each reference year, we simulated potential harvests in each forest stand for 5-year periods using the same yield tables and rotation cycles which were applied in the forest development models . The potential yield of raw wood and biomass (called ‘raw wood potential’ and ‘biomass potential’, respectively) was calculated by aggregating the estimated yield volumes.
The potential yield of raw wood and further aboveground biomass was then allocated to different assortments according to common assortment tables. These assortments are the actual products of a forest enterprise and therefore comprehensive price data is available. Total biomass volume was extrapolated from coarse wood volume using tree species and age specific expansion functions (Dieter and Elsasser 2002). Finally, the value of the raw wood and biomass potential was calculated by combining the price data with the assortment specific volumes.
The different silvicultural concepts , which both scenarios are based on, particularly affect the development of the forest area stocked with the tree species group ‘pine and larch’. In the ‘leitbild’ scenario, the area stocked with ‘oak and other deciduous trees’ increases considerably at the expense of the ‘pine and larch’ area. In contrast, the tree species groups ‘beech’ and ‘spruce, fir, douglas fir’ evolve similarly until 2080 under both scenarios, differing only in the year 2100.
◉ Figure 6.10 compares the development of the raw wood and biomass potential in both scenarios. The potential raw wood volume is approximately 3.5 million m3 in the starting year, 2006. Until the year 2060, the raw wood potential of the scenarios do not differ substantially. It becomes apparent that even a significant change in the management concept (as is simulated in the ‘leitbild’ scenario) only affects the potential raw wood volume appreciably after a time lag of 50 years. The potential raw wood volume in 2060 is more or less similar to that in the starting year. Only from 2080 onwards the raw wood potential develops differently under both scenarios: it increases under ‘bau’, but remains at the same level under the ‘leitbild’ scenario. The biomass potential develops in a similar manner (◉ Fig. 6.10) but constantly exceeds the raw wood potential by about 18 to 20 %.
Fig. 6.10
Development of raw wood (in 1000 m3 of merchantable timber) and biomass potential (in 1000 m3)
The long-term impact of altered silvicultural concepts also becomes apparent when comparing the development of the assortment structure over time. Only from 2080 onwards, the smallwood supply from broadleaves increases considerably. A corresponding increase in the supply of large dimension hardwood is not (yet) visible within the analysed period.
◉ Figure 6.11 shows the development of the raw wood potential’s economic value. Here the total volume of the raw wood potential has been evaluated at 2005 prices (ZMP 2009; due to the lack of price information for wood residues, we assumed a respective price of 15 €/m3 (exempt from harvest costs). The curve therefore reveals only those value changes which are caused by changes in the quantity or the structure of the raw wood potential due to the assumption of constant timber prices during the period under consideration.
Fig. 6.11
Value development of the raw wood potential compared to the year 2006
The value development is different between both scenarios . Under ‘bau’, values increase from € 120 m in 2006 to € 171 m in 2100, an increase of 43 %. In contrast, values slightly sink by 14 % under the ‘leitbild’-scenario during this time, amounting to only € 103 m in 2100. The average revenues from a cubic metre of raw timber remain broadly constant in both scenarios during the given period (this can be concluded from the fact that quantity and value developments are almost proportional; ◉ Fig. 6.10 and 6.11). At least until 2100, the reduced raw timber supply in the ‘leitbild’ scenario is not compensated by higher values of the produced hardwood; rather it results in a loss, amounting to € 70 m in 2100.
6.3.1.2 Carbon Sequestration
The sequestration of carbon in trees is a ‘regulating ecosystem service’ according to MEA (2003) which was brought into wide public awareness by the UN framework convention on climate change . As has been discussed in the previous section, the change in the tree species composition clearly affects timber and biomass stocks and therefore the amount of carbon stored. In order to describe the carbon stock development, the volume of the aboveground tree biomass (merchantable wood, lop and needles) as well as the tree root biomass was extrapolated from the standing stock of merchantable wood. Volumes were converted into masses according to their respective wood density (Kollmann 1982). The carbon content was then transferred according to Lamlom and Savidge (2003).
The development of carbon stocks is very similar to that of the raw wood stocks. Carbon continues to accumulate in both scenarios until 2040 due to the age structure in the project area. However, net carbon sequestration decreases continually over this period. Starting in circa 2060, the harvest of mature forest stands will cause net emissions of carbon in both scenarios. The reduction is more pronounced in the ‘bau’ than in the ‘leitbild’ scenario. Accordingly, the ‘leitbild’ scenario causes less sequestration in the beginning (by 200 Gg C/a in the period 2006–2020), but fewer net emissions in the end (the difference to ‘bau’ amounting to just under 150 Gg C/a in the period 2080–2100).
In regards to the monetary value of the sequestration service, some important caveats have to be kept in mind, especially given the length of the period under consideration. First, the influence of altering silvicultural concepts in northeastern Germany on global climate is only marginal, given the global dimension of the problem. Thus the impact of mitigation on the local population will be almost negligible. Second, prices for certificates at the carbon markets emerging under the European Trading System and the framework convention on climate change may be used as value indicators; however forest sink certificates are not (yet) being accepted. Their acceptance depends on complex international negotiations and it is therefore uncertain if this will change in the future. Even if it does, the agreements reached in these negotiations will heavily influence the scarcity, and thus the price, of carbon emission permits. As a consequence of both considerations, assigning a positive monetary value to regional forest sequestration services is based on optimistic assumptions.
We addressed the associated uncertainty by allowing for a broad value range for the sequestration service. These are oriented at avoided damage costs , on the one hand, and at prices at the various markets for emission permits, on the other. However, even when we assumed a value of 100 €/t CO2 for the whole time span until 2100 (a value which appears rather extreme from today’s perspective), the effect on the total value balance was quite small. In comparison to the ‘bau’ scenario, a forest conversion following the ‘leitbild’ scenario would cause a sequestration value loss of about 5.5 m €/year in the period 2006–2020. By the end of the considered period (i.e. in 2080–2100), it would lead to a gain of about 4 m €/year. In comparison to the losses in raw timber values described above, this effect is negligible.
6.3.1.3 Scenic Beauty and Recreation Values
The MEA counts a landscape’s scenic beauty and its recreation service as ‘cultural ecosystem service’. In order to value these, we conducted a regional population survey. The survey asked several basic questions about the respondents’ attitudes towards the landscape where they live and its management. It also contained a choice experiment to determine a monetary valuation for changes in the scenic beauty and recreation in the landscape.
Choice experiments are a method of preference determination where respondents choose between alternative bundles of goods (▶ Sect. 4.2.3). Each of these goods is characterised by different attributes which assume varying levels. Multinomial logit models are then used to estimate how much a change in the level of each attribute has influenced the choice probability of the respective goods. If one of the attributes is the price or the cost of a good, then a marginal willingness-to-pay (WTP) for the other attributes can be calculated from the obtained statistical measures (see e.g. Hensher et al. 2005 for details).
In this study, 999 inhabitants were selected for the survey. We displayed to each respondent choice cards describing three alternative residential environments. In each alternative, three attributes were varied, namely the view of the landscape (as visualised by computer generated images), the possibility of entering meadows and forests for recreation purposes, and the cost of living there (as a price indicator). The computer images showed various landscape views typical of the region in summer or in winter. Alternatively, a pine forest, a deciduous forest or a mixed forest, each with high or low structural diversity or a meadow without trees were shown. Interviewees were asked to choose their most preferred landscape among the three presented choice options.
The analysis showed that the ecosystem service ‘recreation’ (here defined as the possibility to enter meadows and/or forests for recreation purposes) has a substantial monetary value. It amounts between 55 and 90 € per household and year. This is in line with the result of comparable studies. The valuation of the landscape views revealed that all alternatives which contained forests were clearly preferred over the situation without trees. This result is independent of tree species and the level of structural diversity in the forest images . A closer comparison between the various forest images show that households have a significant WTP for deciduous and mixed forests rather than coniferous ones–but only if the images show forests in their summer aspect. Summer aspect WTP ranged between more than 40 and more than 85 €/household/year. If the images additionally showed high structural diversity, this resulted in an extra 20 €/household/year. In contrast to this finding, no general preference for deciduous and mixed forests in their winter aspect could be confirmed. However, structural diversity of forest stands played an even more important role in winter than in summertime: The additional WTP for high structural diversity under winter conditions was between 90 and 160 €/household/year.
Based on these results, it was possible to examine the long-term impacts of forest conversion on the landscape views over time and then to extrapolate WTP of the regional population. For this purpose we weighted the valuation results for the summer and winter aspect, respectively, at a rate of 7:5 (according to the length of the vegetation period). Two variants were calculated in order to account for the influence of structural diversity on results. For a ‘lower’ variant we supposed that future forest conversion will always produce forests of low diversity. In contrast, a ‘diversified’ variant was calculated using the forest views which showed high structural diversity. For simplicity we assumed the pace of the forest conversion will be driven by silvicultural considerations only (i.e. no concentration along settlement centres, for example), and that population numbers as well as their preferences remain constant over time.
According to this extrapolation, landscape values will increase over time in both scenarios because both envisage a forest conversion of purely conifer stands into stands with higher shares of deciduous trees (even though the extent of the conversion is considerably lower in the ‘bau’ scenario). Because of the stepwise realisation of the conversion programmes, landscape values are highest at the end of the period. In a short to medium term view the consumer surplus difference between both scenarios is comparatively small; for 2020 it amounts to 3.0 m €/year in the ‘lower’ variant (or 6.2 m €/year respectively, if high diversity of the converted stands is assumed for both scenarios). Until 2100 the difference increases to 16.0 m €/year (or 34.1 m €/year respectively, in the ‘diversified’ variant). When interpreting these last-mentioned numbers it should however be kept in mind, that such projections into a distant future inevitably imply substantial uncertainties.
6.3.1.4 Synopsis and Discussion
The balance of the monetary values of all forest ES considered here changes over time. A look at the respective temporal development reveals that no appreciable monetary losses occur until about 2060, if the ‘leitbild’ scenario is put into practice; the balance is even slightly positive in the ‘diversified’ variant of landscape development which assumes a conversion into highly diverse forest stands. After 2060 however, neither the positive influences on landscape values nor the (weakly) positive influences on carbon sequestration are able to compensate the significant losses due to decreased wood production. This is true even if unrealistically high sequestration values are being assumed: in 2100, the realisation of the ‘leitbild’ scenario would cause a utility loss of 30–50 m €/year in comparison to ‘bau’-oriented silviculture, depending on calculation variant. ◉ Figure 6.12 illustrates this finding (a: without carbon sequestration values; b: assuming a carbon sequestration value of 100 €/t CO2. The very small differences between both parts of the figure demonstrate how weakly the carbon sequestration service impacts the overall result) (. Fig. 6.12).
Fig. 6.12
Development of the value balance of wood production, landscape view, and carbon sequestration service under forest conversion according to the ‘leitbild’ as compared to the ‘bau’ scenario (a: CO2 base price = 0 €/t; b:100 €/t)
Although the losses uncovered here will be relevant in a more distant future only, such a result violates norms of sustainability as well as intergenerational justice–even if substitutability between different forest services is permitted, as is implied by ‘weak’ sustainability approaches . When interpreting this result it should be kept in mind that the value balance presented here, and its temporal development, are based on a number of simplifying assumptions:
1.
In the absence of more reliable information, the long-term considerations above assume continuousness in the overall economic development, in the sense of constant value relations between timber market values (which dominate the overall result) and other goods and services, including the forest ES valued here.
2.
Constancy in the long run is assumed with regard to growth conditions for trees, too. If tree growth will decrease in the future due to changing environmental conditions (e.g. because of increasing drought stress), then the influence of wood production on the overall result will diminish in relation to other forest ES–at least under the condition that the value of these other services will be less affected by the growth decrease, or not affected at all. Under enhanced growth conditions for trees (e.g. due to extended annual growth periods) this will be the other way round.
3.
Production risks as well as their possible shifts due to climate change are not taken into account in the present investigation–neither natural risks (e.g. droughts, fire, storms, insect calamities) nor financial ones (including changing price relations between tree species). Generally, forest conversion in the sense of the ‘leitbild’ can lead to a better distribution of unknown risks and may be economically rational in this sense (see e.g. Knoke et al. 2008), thus qualifying the long-term utility loss associated with a realisation of the ‘leitbild’. However, the present silvicultural strategies underlying the ‘bau’ scenario provide for some forest conversion, too, albeit to a lesser extent. It is not possible to determine objectively which degree of forest conversion is most advantageous for distributing production risks, since this depends also on the risk aversion of today’s decision-makers.
4.
In addition to timber markets the present investigation captures landscape views, recreation and carbon sequestration as important ES which would be affected if the ‘leitbild’ was realised. Nevertheless important impacts on other potentially affected ES remain unconsidered, like e.g. water supply and consumptive use of forest biodiversity. However, a well comparable study on the influence of a forest conversion programme on regional biodiversity values is available from two regions in Lower Saxony (Liebe et al. 2006 in Meyerhoff et al. 2006). According to the mentioned study, a third to half of the respondents in the regions of Lüneburger Heide and Solling were generally prepared to pay for increasing the amount of deciduous trees and related biodiversity improvements (the programme provided for increasing the share of deciduous trees from 30 and 40 %, respectively, to 60 %, corresponding to the state forest administration’s conversion programme LÖWE (Niedersächsische Landesregierung 1991). With regard to the motives for the decision to pay, the attributes ‘biotope protection’ and ‘species protection’ ranked highest, even higher than ‘increasing landscape diversity’. This finding emphasises the relevance of biotope protection services. Nonetheless, mean WTP for the conversion programme (about 6 to 15 €/person/year depending on valuation method) was in the same order of magnitude as the WTP identified in the present study for landscape views, even slightly lower. This implies that even if biodiversity values were additionally included here, the abovementioned sustainability violation would likely not be dispelled: It persists even if it is assumed that the ‘leitbild’ scenario’s positive influences on biodiversity values might be much higher than those on landscape values.1
5.
Finally it must be stressed that the present investigation did not aim at a comprehensive benefit-cost analysis . Specifically, investment costs of forest conversion have not been an issue here; therefore the presented value balances do not contain such costs. The higher these costs are in reality (e.g. for planting and maintaining deciduous trees, protecting them against damage from game animals, etc.), the more adverse will the balance become with regard to a realisation of the ‘leitbild’ of ‘climate adaptive deciduous mixed forest’. Likewise it will become increasingly questionable whether the positive balance indicated here until 2060 under inclusion of public goods (and under partly optimistic assumptions about their values) will persist at all. Even when allowing for positive impacts on ES it can be inferred, that a forest conversion according to the ‘leitbild’ will most probably only be compatible with economic and sustainability goals if conversion costs can be restricted to a minimum.
Conclusion
What are the conclusions which can be drawn from this case study, for MEA’s ecosystem approach (MEA 2003) and for the economic valuation of ES in general? The MEA approach focuses at the entirety of services which may be affected by management and utilisation (here: of forests), and thus it helps keeping essential environmental aspects in view, which go beyond mere production goals. Thereby the MEA approach takes up the important concern of environmental economics that external effects be identified and quantified, in order to be incorporated in decisions of environmental relevance . Even though including every ecosystem service possibly affected by any intervention might turn out impossible due to data limitations, the present case study demonstrates that quantifying and valuing important provisioning, regulating, and cultural ecosystem services (CES) is indeed possible. Generally this is also true for ‘supporting services’ . However, most supporting services do not have direct consumption benefits, but rather serve as inputs for the production of other goods. Thus their value should not be added to the values of the produced goods, in order to avoid double counting (▶ Sect. 3.2.5).
6.4 Urban Ecosystem Services: Leipzig as a Case Study
D. Haase8
(8)
Geographisches Institut, Humboldt-Universität Berlin, Rudower Chaussee 16, 12489 Berlin, Germany
Urban ecosystem services (Bolund and Hunhammar 1999; TEEB 2010; Elmqvist et al. 2013; Haase et al. 2014) describe ecosystem functions (processes, structures), which are provided by nature or the urban ecosystem and used by the inhabitants of a city and/or a metropolitan area. Examples of urban ES are the provision of freshwater and drinking water from precipitation and the natural filtration of soils, the regulation of peak run-off during periods of extreme precipitation and the resultant reduction of high water in urban areas, food production (fruit, vegetables) in urban gardens or garden allotments, the pollination of fruit trees by urban bees or the provision of fresh (cool) air from open spaces and recreational areas.
Without ES, our life as we know it today, would not be possible in the city (Guo et al. 2010; Haase 2011). Some studies have attempted to express urban ES in terms of monetary value to emphasise the economic importance of and dependency on nature–particularly in cities (Gómez-Baggethun et al. 2010; Bastian et al. 2012). In addition, non-monetary models and assessment approaches (as presented in the following) are very well suited to emphasise the importance of urban ES.
According to the Millennium Ecosystem Assessment (MEA 2005), the TEEB study Manual for Cities (2010) as well as Fisher et al. (2009), urban ecosystem services can be divided into four categories (◉ Table 6.6): provisioning services (food, water, raw materials, genetic resources, medicinal resources, etc.), regulating services (regulation of climatic extremes such as heavy precipitation or extreme summer heat, floods, diseases, water and air quality , waste management, etc.), cultural services (recreation, aesthetics, spiritual fulfilment, environmental education, etc.), and supporting services (in the broader sense, ecosystem processes and functions such as soil formation, biodiversity, pollination , nutrient cycles, etc.). Urban ES are very closely to the urban quality of life (Schetke et al. 2012; Santos and Martins 2007), which is based on the three dimensions of sustainability and rather expresses city dwellers ‘needs’ for services, which are partially covered by ecosystems and/or ecosystem functions . The complementary role of both concepts is presented in ◉ Table 6.6.
Table 6.6
Urban ecosystem services and indicators for the quality of life in sustainability dimensions
Sustainability dimension | Urban ecosystem service | Indicator for urban quality of ilfe |
|---|---|---|
Ecology | Air filtering Climate regulation Noise reduction Rainwater drainage Water supply Wastewater purification Food production | Health (clean air, protection against respiratory illnesses, death from heat exposure and hypothermia) Safety Drinking water Food |
Social | Landscape Recreation Cultural values Environmental education | Aesthetics of the environment Recreation, stress reduction Intellectual enrichment Communication Living area |
Economy | Allocation of land for economic activities and transport | Accessibility Income |
6.4.1 Urban Ecosystem Services and Urban Land Use: A Complex Nexus
Urban ES are very closely linked to urban land use (◉ Fig. 6.13). On a global scale, urban land use constitutes at the most 4 % of the Earth’s surface, and yet more than half of the world’s population now live in cities; with trend still on the rise (Seto et al. 2011). From an economics point of view, 95 % of today’s cumulative global gross domestic product is generated in cities. The sealing and conversion of semi-natural areas and agricultural land into settlements and roads belong to the most significant effects (mostly of a negative ecological nature) all over the world, with such effects often being irreversible. The rural–urban gradient that is emerging is characterised by dispersed land-use development with an increasing amount of land sealing in city centres (Haase and Nuissl 2010). Sealed /partly sealed soils can no longer (or at least only to a restricted degree) fulfil the urban ES described above (Haase and Nuissl 2007; ◉ Fig. 6.13 and 6.14). Therefore, possible courses of action in the field of urban land use to secure ES are always part of a multi-criteria compromise, which has to be (re-)negotiated time and again (▶ Sect. 5.1, 5.4).
Fig. 6.13
The nexus between urban land use and urban ecosystem services—the options for defining urban land use to secure urban ecosystem services will always be a compromise to suit both socio-economics and the ecosystem. This ‘search’ for compromises has to be (re-)negotiated. Multicriteria assessment, trade-offs as well as partial optimisation can all be useful methods in defining compromise
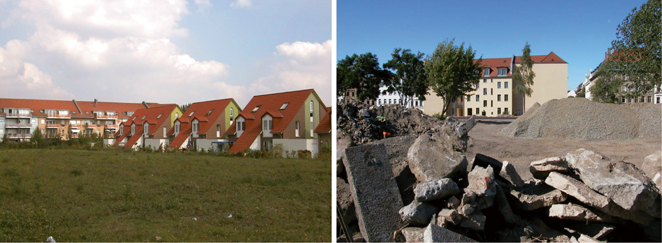
Fig. 6.14
Restriction and potential of urban ecosystem services from urban development and land sealing (Munich, left) as well as land use perforation from shrinkage (Rabet in Leipzig, right). © Google Earth 2011
In particular, the land-use types of urban open spaces, urban green and forests provide the most diverse urban ES for urban residents. For example, wooded areas and parks contribute to regulating extreme temperatures, by reducing surface radiation and temperature by casting shadows and from increased evapotranspiration (Bowler et al. 2010, Kottmeier et al. 2007). Moreover, all kinds of urban green areas, even urban wastelands or brownfields and waterbodies can contribute to the well-being of urban residents. Undeveloped floodplains primarily regulate flooding (Haase 2003). Unsealed land surfaces are suitable for rainwater retention and percolation, and are therefore able to regulate rapid aboveground discharge runoff from heavy rain events. Rainwater seepage installations especially designed for this purpose in residential areas can additionally serve as in situ rainwater utilisation (Haase 2009). With respect to the increasingly more important debate on anthropogenically induced climate change, urban green areas (above all trees and forests) can contribute to local carbon sequestration . Admittedly, current studies only refer to 1–2 % of the emissions resulting from cities that can be neutralised by urban vegetation (Strohbach and Haase 2012 for Leipzig, Nowak and Crane 2002 for US cities). In spite of this small contribution, however, land uses with tree cover still contribute towards reducing the ‘ecological footprint’ of a city.
Recently, another process (that is moving in the opposite direction from urban growth) has been given increasingly more attention: urban shrinkage . Cities labelled with economic problems and population losses are characterised worldwide by a decrease in the intensity of urban land use , vacant premises as well as urban wastelands (◉ Fig. 6.14; Haase et al. 2007). This land-use perforation (Lütke-Daldrup 2001) provides the unique opportunity for the revitalization of (inner)-city areas (Lorance Rall and Haase 2011) and an associated ‘revitalization’ of urban ES (Haase 2008).
A prime example of simultaneous urban growth and shrinkage is the city of Leipzig situated in one of the new German federal states of the Federal Republic of Germany (Lütke-Daldrup 2001). The following examples of the analysis and evaluation of urban ES refer to Leipzig and are internationally published.
6.4.1.1 An Example of Local Climate Regulation
The current discussion about adaptation to climate change in cities aims at reducing the temperature of existing open spaces (green areas, waterbodies, floodplains) in the city (Bowler et al. 2010; Gill et al. 2007; Jin et al. 2005; Tratalos et al. 2007). Urban green areas and waterbodies are able to produce cool air due to their specific heat evaporation and counteract high summer temperatures (Gill et al. 2007) .
In addition, shaded areas play an important role: here the temperature reduction compared to a sunny location can be up to a maximum of 5 K per 10-minute interval during diurnal variation. As shown in ◉ Fig. 6.15 for the City of Leipzig, an increase in the amount of shade (i.e. the percentage of park areas with tree cover and/or the number of trees in parks) of urban green spaces benefits the temperature regulation effect (Bowler et al. 2010). The cooling effect of 3 K (on average) in the diurnal variation from shading is thereby empirically determined: on the one hand it is measured and on the other hand it is extrapolated to the urban area by using data from the aerial photography of shaded areas in parks.
Fig. 6.15
The temperature difference between areas exposed to the sun and shaded areas of urban parks in late summer in Leipzig (own data from data collection in August 2009). Air temperature was measured with temperature sensors and recorded by means of a data logger. An average temperature difference of 3 K was empirically calculated between shaded and nonshaded areas for different parks and the 40 % shade determined by remote-sensing data was transferred to all parks in the city. Hence, it was possible to simulate the effect of increased and/or decreased shade on the regulation of the local climate (cooling) in public parks for scenarios of urban shrinkage, urban restructuring and re-urbanisation. Apart from which, the urban ecosystem services effect “climate regulation from shading” could be calculated for various reforestation measures in urban parks
Using indicators such as shade, but also surface emissivity or f-evapotranspiration, the effects of local climate regulation of urban areas and land use patterns can be estimated. Schwarz et al. (2010) quantified the effects of town-planning measures for the local government District of Leipzig such as economic development, the designation of industrial land, land reclamation from open-cast mining as well as the effect of regional green belts (◉ Fig. 6.16).
Fig. 6.16
The effects of different planning instruments on the urban ecosystem service ‘local climate regulation’ for the local government District of Leipzig (compared with Corine Land Cover Data in the base year 2000 (= CLC 2000)). On the right the indicator surface emissivity (*), in the center the indicator f-evapotranspiration (**) and on the right the aggregated indicator values for CLC2000 and the planning measures considered. Land-use changes resulting from planning measures were incorporated into the GIS, by editing the areas with measures as polygons and accepting an appropriate new/altered land use form. © Schwarz et al. 2011
6.4.1.2 An Example of Flood Regulation
The urban ecosystem service `flood regulation’ that is particularly important in cities, can be simplified by the following eq. 6.1, in which the precipitation N is the sum of discharge A (base runoff [Ab], intermediate [interflow Ai] and surface runoff [Ao]), evaporation ETP and intermediate storage S :
(6.1)
Unlike river catchment areas, the amount of sealing and the size of the sewer systems play an important role, as they determine how much precipitation water is available to the ecosystem and/or how much directly gets into the receiving water from direct runoff (Haase 2009). Here, it applies: the higher the degree of soil sealing, the lower the base and/or intermediate runoff, the higher the surface runoff and the lower the flood water regulation. Urban ecosystems are very vulnerable to discharge points and local flooding and/or ground water flooding.
An efficient method for calculating water regulation within an urban area is the empirically determined Bagrov-relationship (eq. 6.2), with which the total runoff (Q) is calculated from the real evapotranspiration (ETa) of an area (Glugla and Fürtig 1997). The total runoff (Q) is calculated by the difference between the real evapotranspiration (ETa) and the long-term precipitant (N). With increasing N, ETa is closer to the potential evaporation (ETp), while with decreasing N, ETa is closer to this. The intensity, with which these boundary conditions are reached, is altered by the storage properties of the evaporating surface (effectiveness parameter n), which are determined by the land use, soil sealing and soil type:
(6.2)
From the base runoff it is then possible to calculate the direct runoff by determining the proportion p of surplus water (the difference between precipitation and evaporation), where p is derived from the initial parameters, slope inclination, soil type, depth to the water table and the land use and/or the degree of sealing (eq. 6.3; Haase 2009):
(6.3)
One of the results from calculating flood regulation is shown in ◉ Fig. 6.17 using the example of the City of Leipzig over the period 1870–2006.
Fig. 6.17
Change in the surface runoff Ao in the City of Leipzig between 1870 and 2006, calculated after the procedure explained in ▶ Sect. Fehler! Verweisquelle konnte nicht gefunden werden.. The urban ecosystem services in this case are the difference between the values from 2006 to 1870, displayed in the legend below. One notices a considerable loss of flood regulation services due to sealing in Leipzig, shown as positive differences (growth)
6.4.1.3 An Example of Carbon Sequestration in the Urban Area–Reducing the Ecological Backpack of the City?
On the one hand, cities belong to the main emitters of carbon dioxide (Churkina 2008). On the other, they are also able to fix some of these carbon dioxide emissions–primarily in soils and trees. Carbon sequestration belongs to the global most important urban ES that are provided in cities, even if this contribution is quite small in terms of figures. How can one assess the contribution (balance) of a city to the global carbon balance?
For the city of Leipzig carbon storage from urban vegetation (trees) was empirically determined and modelled with the goal of
Obtaining a spatially explicit representation of carbon storage and
Establishing comparative values of carbon sequestration from trees for typical urban land-use types (Strohbach und Haase 2012).
For this a stratified random sample of 190 locations was laid over 19 land-cover classes, for which the percentage of trees, the age of the trees, the species as well as the DBH were all determined. Moreover, the tree crown cover was derived from colour-infrared images (CIR) by means of object-oriented random forest algorithms (for details on the method see Strohbach and Haase 2012). The tree crown cover of the entire city area was quantified with 19 %. Using the data on the tree trunk diameter, it was possible to determine the aboveground biomass of the trees as well as stored carbon by means of allometric equations.
By applying the above methodology, a total carbon storage of 316,000 Mg C or 11 Mg C per hectare could be determined in the aboveground tree biomass of Leipzig. The highest values were determined for residential areas and floodplain areas (◉ Fig. 6.18). Compared to values from US American and Chinese cities (Hutyra et al. 2011) and compared with the annual CO2 emissions of the city, the carbon storage values for Leipzig are rather small–and yet they should not be underestimated. This quantification method is particularly suitable for assessing the carbon mitigation potential of urban restructuring projects for cities in decline, as Strohbach et al. (2012) found for the demolishing and subsequent use projects ‘dark forest’ and ‘floodlit grove’ in the east of Leipzig.
Fig. 6.18
Spatial distribution of the carbon sequestration capacity of the urban vegetation in Leipzig after urban structure and/or land-use types (Strohbach and Haase 2012). The lowest values came from urban agricultural areas, the highest came from the floodplain forest that runs through the city. Similarly, areas with Wilhelminian architecture and villas showed above average values for carbon sequestration. The locations were determined by random sampling and the carbon data were recorded in the field by measuring the DBH of trees as well as the respective allometric curves of the relationship between DBH and aboveground biomass established
6.4.1.4 An Example of the Recreational and Nature Experience
Urban green areas (including their habitats and biotopes) provide a multitude of ecological functions and thus also provide many urban ES (Haase 2011). Public green spaces include urban forests, parks with tree cover, cemeteries, sports fields with little or no tree cover and successional wastelands . Even the green spaces along the sides of roads act as urban biotopes (Breuste et al. 2007). In addition, there are also private urban green spaces such as back gardens, allotment gardens or golf courses. Their significance in terms of their function not only as habitats but also as regulators is by far underestimated. Generally speaking, the urban ES of urban green spaces range from the biotope formation function in the true sense to the nature conservation function (species diversity), the bioindicator and information function (clean air), the climate regulation function (provision and storage of cool air), the soil protection function (filtering, buffering) as well as some particularly important functions for urban inhabitants including recreation, noise buffering, the townscape, as well as educational and historical functions (Burgess 1988; Bolund and Hunhammar 1999). Parks, playgrounds, meadows, cemeteries, green wastelands and urban forests secure the recreational function of humans in the city. They help to maintain mental and physical health as well as making it possible to experience nature (Yli-Pelkonen and Nielemä 2005; Chiesura 2004). Consequently, they need to be classed as considerable determinants of the urban quality of life (Santos and Martins 2007). Besides which, they provide aesthetic pleasure and inspiration in the city (Breuste 1999).
One can determine the supply and demand of urban green spaces for recreation very efficiently using geographical information systems (e.g. ArcGIS) on the basis of land-use data and local government statistics (Comber et al. 2008). Indicators , which were determined for the City of Leipzig on the other hand (◉ Fig. 6.19) are area of, percentage of and per capita area of urban green as well as its accessibility (buffer or network analysis). Many cities have specified threshold values for these indicators (Kabisch and Haase 2011). Furthermore, gradient analyses of green area requirements and potential demand as well as dissimilarity indices such as Gini or Theil are suitable for describing the concentration (fairness) of the recreation function.
Fig. 6.19
Recreation function in Leipzig: portrayed as a green area map for 2003 (upper left), as a gradient of supply and demand (top right) as well as equity on the municipality level for two land-use time steps (below)
Gruehn et al. (2006) analysed the effect of urban green spaces on the value of properties and real estate (▶ Sect. 4.2). The results show that there are numerous positive effects from open spaces and green spaces on the standard land value of up to 20 %, depending on the function, configuration , accessibility, residence quality and spatial configuration of the area. It should be noted however that these values depend on the city in question and are therefore to be taken as approximate values .
The Status of Urban Ecosystem Services Implementation in Germany
Despite the heated international discussion on ES and their enhancement (see MEA 2005; TEEB 2010), so far administrative institutions responsible for the planning of German cities have been hesitant to take up the issue. There is a German participation and numerous activities on the IPBES-platform (Intergovernmental Science-Policy Platform on Biodiversity and Ecosystem Services) but contrary to the USA, the UK, the Netherlands (Termorshuizen and Opdam 2009) or Switzerland (Staub et al. 2011) for example there are still no generally applicable guidelines for the implementation of approaches using urban ecosystem services for (urban) landscape planning. Nevertheless, governance structures of town and city development and landscape/nature protection often apply the principles of the urban ES concept like for example the temporary use projects in Berlin or Leipzig (here: licence agreements on interim land use, Lorance Rall and Haase 2011).
6.5 Cultural Landscapes and their Ecosystem Services
6.5.1 The Example of Orchard Meadows in the Swabian Alb Biosphere Reserve
B. Ohnesorge9 , C. Bieling10, C. Schleyer11 and T. Plieninger12
(9)
Warthestraße 17, 12051 Berlin, Germany
(10)
Institut für Landespflege, Albert-Ludwigs-Universität Freiburg, Tennenbacher Straße 4, 79106 Freiburg, Germany
(11)
Dept. of Environmental Politics, Helmholtz-Zentrum für Umweltforschung GmbH – UFZ, Permoserstraße 15, 04318 Leipzig, Germany
(12)
Department of Geosciences and Natural Resource Management, Landscape Architecture and Planning, University of Copenhagen, Rolighedsvej 23, 1958 Frederiksberg C, Denmark
6.5.1.1 Introduction
Europe’s land cover has been shaped to become a mosaic of cultural landscapes by wide-ranging and comprehensive human use for centuries (Schaich et al. 2010). The term ‘cultural landscape’, on the one hand, emphasises the aspect of anthropogenic cultivation and visible changes to the natural landscape due to continuous use. On the other hand, it includes a cognitive dimension pointing to the cultural meaning (▶ Sect. 3.4) humans assign to the space surrounding them and to the natural and anthropogenic elements therein (Jones 2003). Human influence on natural landscapes is often associated solely with disturbance and negative influences. But mankind can also contribute in many ways to the diversity and uniqueness of a landscape, be it through socio-economic, emotional or intellectual input (Moreira et al. 2006).
While a large part of scientific literature deals with capturing ES on the ecosystem scale, this chapter points to ES delivered on the landscape scale. Cultural landscapes usually embrace a multitude of different habitats. Forest patches, meadows, hedgerows and streams, for example, all deliver specific ES locally. Their composition on the landscape scale delivers additional services such as the regulation of the landscape water regime, groundwater renewal or pollination of cultural crops by wild insects. On this scale, the CES play an important role. Due to the long history of human use and the intense interaction between man and nature, cultural landscapes are closely linked to a sense of place and cultural heritage, but also to values, biographies and identities (Schaich et al. 2010). Moreover, recreation, inspiration and spiritual edification by enjoying cultural landscapes become ever more important, as most Europeans spend an increasing amount of their time in cities and inside buildings.
The cultural services should, thus, be taken especially into account whenever the ES concept is applied to cultural landscapes. Despite the central influence cultural services have on well-being and quality of life, they are still only marginally accounted for in studies capturing and valuing ES. One reason is that they are hard to grasp, to quantify or to spatially represent, compared to most regulating or provisioning services (Chan et al. 2012). In the following chapter, we use the example of orchard meadows in the Swabian Alb Biosphere Reserve to demonstrate the importance of cultural services and introduce a method for the spatial recording of their manifestations. We explain some examples of instruments and initiatives for the conservation of orchard meadows (Payments for Ecosystem Services) and discuss the implementation of the ecosystem service concept in landscape management.
Orchard Meadows
Scattered fruit tree or orchard meadows are an excellent study area as they combine many attributes of traditional cultural landscapes: a mixture of low-intensity orchards and agricultural use , a small-scale landscape mosaic and structural richness favour a high biological diversity . This type of landscape also brings forward considerable cultural services such as recreation and a ‘sense of place’ (◉ Fig. 6.20).
Lucke et al. (1992) define scattered fruit trees as “generally tall growing trees of different fruit species, varieties and age brackets, standing ‘scattered’ in irregular intervals on fields, meadows and pastures. The term also includes singular trees along paths, roads and slopes, small groups of trees, tree rows and extensive sites with trees standing in regular, but large intervals”. Apple, pear, prune plum and sweet cherry are the most common species.
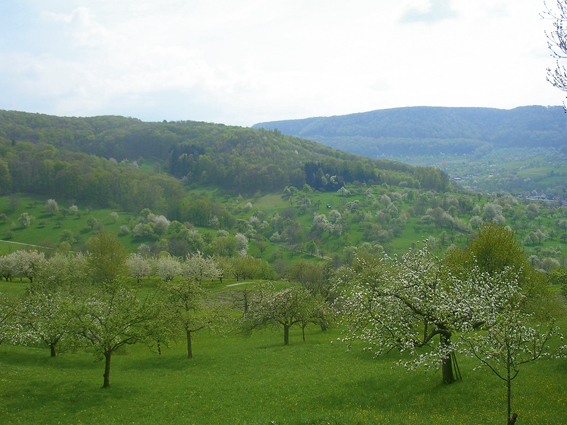
Fig. 6.20
Orchard meadows are characteristic of many Central European cultural landscapes. © Tobias Plieninger
6.5.1.2 From Efficient Food Production to Threatened Cultural Heritage: Orchard Meadows in the Course of the Centuries
Orchard meadows are common landscape elements in eleven European countries and comprise a total of about 1 million hectares. Their distributional range extends from Northern France to Southern Germany and Switzerland to Poland. In the German state of Baden-Württemberg, orchard meadows cover approximately 116,000 ha and 7.1 % of the agricultural land . The largest contiguous area of orchard meadows occurs at the northwestern border of the Swabian Alb Biosphere Reserve , approximately 30 km southeast of Stuttgart, situated in the foothills of the Swabian Alb mountain range. This region exhibits a mild climate and a diverse landscape scenery, which is characterised by extensive, richly structured orchard meadows around settlements , small-scale agriculture, and deciduous hillside forests. Due to its location within the Stuttgart metropolitan area, the area has a high population density of 719 inhabitants per km2. Therefore, the orchard meadow landscapes are not only of importance for biodiversity conservation but also for landscape-related recreation (LUBW 2009). The ecoregion harbours around 600,000 scattered fruit trees and 6,000 ha of orchard meadows.
Orchard meadow landscapes are appreciated for the diverse ES that they provide to society. Among the provisioning services fruit production is important–despite a widespread conversion to high-performance fruit plantations (Weller 2006). Appreciated products are dessert fruit, fruit juices, cider and liquors. Also, orchard meadows provide cultural services as scattered fruit trees are outstanding components of an aesthetically pleasing landscape. Due to their location close to villages and towns, they contribute to recreation and often attract day tourists. Substantial regulation services are supplied by positively influencing local climates (e.g. through wind protection or shading) , by halting soil erosion on hillsides, and by reducing nutrient inputs into water bodies. The large diversity of fruit varieties (more than 3000 fruit varieties have been recorded in Germany; MLR 2009) represents an important genetic resource. Finally, orchard meadows offer habitats to many plant and animal species (Herzog 2000).
Orchard meadows were introduced in many German regions as innovative land-use systems in the eighteenth and nineteenth centuries, often supported by the respective government. The principal aim was to improve profitability of agriculture and the provision of food to local people. In a first stage, fruit trees were planted in home gardens and on crop fields; at a later stage, these were often converted from croplands to meadows. Important land uses on the ground were livestock grazing as well as cultivation of fodder, cereals, root crops, horticultural crops, and berries. The orchard meadow economy culminated in the middle of the twentieth century. The last large-scale plantations of orchard meadows took place during and shortly after World War II, in order to supply people with fresh fruit (Müller 2005).
Orchard meadows have been strongly declining since the 1950s. While agricultural statistics for the federal state of Baden-Württemberg recorded 18 million scattered fruit trees in 1965, only 11.4 million trees were counted in 1990 and 9.3 million trees in 2009 (MLR 2009). Many orchard meadows were replaced systematically by modern and intensive fruit plantations, which allow a rational management based on machinery. In the 1960s and 1970s the federal state of Baden-Württemberg and the European Economic Community subsidised the clearing of orchard meadows in order to promote the ‘modernisation’ of orcharding. In consequence, approximately 15,700 ha of orchard meadows were removed between 1957 and 1974 (Weller 2006). Many of the orchard meadows close to urban areas vanished through establishment of settlements and industrial areas. The construction and upgrading of roads implied a loss of many scattered fruit tree rows.
The conservation of orchard meadows depends on active management, in particular regular pruning and renewal of trees. With the rising competition of intensive plantations and changing consumption patterns (e.g. increasing quality demands towards dessert fruit), traditional orcharding practices often lost profitability. Due to land abandonment and lacking regeneration of trees, many orchard meadows were encroached by bushes and shrubs while many fruit tree stands are overaged and deceased through lack of management. The remaining scattered fruit tree stands are usually not managed by professional fruit growers, but by hobby and self-sustaining farmers (Weller 2006). The fruit trees are overwhelmingly found on meadows and pastures, while scattered fruit trees have largely vanished from croplands.
6.5.1.3 Manifestations of Cultural Ecosystem Services of Orchard Meadows
Despite, or maybe because of their decline, the significance of orchard meadows as an extremely valuable landscape feature is increasingly stressed by the local population, but also by particular stakeholder groups like conservationists or representatives of tourist associations. Their values are most commonly described in terms of CES like aesthetics, sense of place and cultural heritage. In the following section, we present an approach that delivers concrete insights into the character and prevalence of CES related to an area covered with orchard meadows in the foothills of the Swabian Alb in southwestern Germany.
Manifestations of CES in the Foothills of the Swabian Alb
The method applied begins with the consideration that, like in the case of agricultural land use, the use of cultural services also leaves traces in the landscape. Campfire places indicate recreational use, wayside crosses reflect religious values, and well-tended historical features show that cultural heritage is relevant. These are visible manifestations of CES, and the basic idea of the proposed approach is to record such visible signs of people actually using ecosystem features in an intangible manner. The approach corresponds with the notion highlighted, for example, by Eiter (2010) and Stephenson (2008) that the experiencing of landscapes, i.e. their use, is a crucial constituent for landscape values.
We explored the potentials and constraints of this approach using the example of an area covered with orchard meadows. In a systematic field-walking procedure, all visible signs of use, which are predominantly related to intangible services, were recorded and documented in a map, which was later transferred to a GIS (for a detailed description of methods and results see Bieling and Plieninger 2013). In the investigated area, manifold and numerous manifestations of CES were identified and were grouped into seven categories of similar uses: benches (◉ Fig. 6.21), subsistence gardens, hunting facilities, recreational facilities (e.g. small private huts, barbecue places), manifestations indicative of cultural ties to the past (e.g. commemorative plaques), trails and signs for hikers and cyclists as well as ‘other’ (e.g. a small Christmas tree plantation likely to indicate religious values, but as a source of subsistence also connected to identity) (◉ Table 6.7). Subsistence gardens and hunting facilities were interpreted as predominantly indicating intangible services, because gardening and hunting entail strong connections to questions of identity, but also to social relations and recreation, which typically outweighs the significance of the products obtained (e.g. vegetables, game meat).
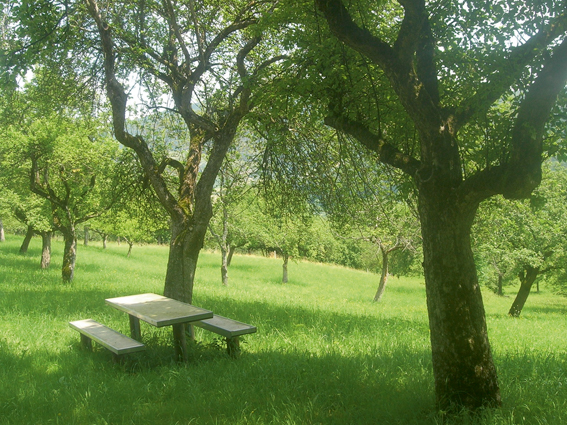
Fig. 6.21
Bench as manifestation of aesthetic and recreational services. © Claudia Bieling
Table 6.7
Types of cultural ecosystem services (CES), associated visible manifestations and their relevance in the investigated area
CES types | Associated visible manifestations | Relevance (recorded manifestations/total number of manifestations) (%) |
|---|---|---|
Identity | Subsistence gardens, hunting facilities, pond, Christmas tree plantation | 28 |
Cultural heritage | Memorials, commemorations, historical sites | 5 |
Spiritual/religious services | Christmas tree plantation | 1 |
Inspiration | – | 0 |
Aesthetic services | Benches | 11 |
Recreation | Hiking trails and signs; recreational facilities; benches; subsistence gardens; hunting facilities | 55 |
In a second step, the categories of recorded manifestations were connected with the types of CES as described in the MEA 2005 (◉ Table 6.7). Manifestations of recreational values and identity were particularly frequent, whereas inspiration and spiritual/religious values seemed to be of little relevance in the investigated area.
Two aspects have to be considered when drawing conclusions from these findings: first, this exploratory study shows that visible manifestations are good indicators for some, but not for all types of CES. For instance, it was not possible to find any indicator for inspirational services, even though it is highly probable that people do actually derive inspiration from the investigated orchard meadows. In this regard, the landscape is probably not the right place to look for manifestations, and indicators might be better found in places like local art exhibitions, regional literature and poetry or children’s kindergarten drawings. Second, manifestations of CES are highly context-dependent, and it would not be appropriate to compare results between different natural and cultural contexts. For instance, we hardly found any manifestation for spiritual/religious values in our case study area, which belongs to a predominantly Protestant municipality. In Protestant culture it is not common to express religious values through manifestations such as wayside crosses, which can often be observed in Roman Catholic-dominated areas. However, this does not necessarily mean that people in this Protestant municipality attach less spiritual values to their surroundings than their Catholic neighbours a few kilometres away, where one would certainly find more indicators of spiritual services.
Visible manifestations can be analysed in a spatially explicit way, which offers several benefits: On the one hand, hot spots of CES provision are revealed, on the other hand, places are indicated which have relatively little relevance in this regard. Moreover, as can be seen from visualising the results in a GIS and applying statistical analyses, the approach helps to identify common overlaps of different ES. In our example, places that provided recreational services typically also were important in terms of identity and cultural heritage. Likewise, the linkages between CES and variables like topography or exposition may be investigated. However, the complexity of assigning CES to a specific place has to be considered. For example, aesthetics like a beautiful view depend both on the place of ‘consumption’ (the place where the view is enjoyed) and the place of provision (i.e. the landscape being viewed).
Cultural Ecosystem Services as a Facilitator of Sustainable Land-Use Practices
The example of the orchard meadows shows that cultural landscapes are tightly linked to CES. This applies to tourists, but even more to the local population and particularly land owners, which are most relevant for the implementation of sustainable land-use practices. Nonmaterial values play an outstanding role in land owners’ land-use decisions. This is, for instance, revealed in a study on how nonindustrial private forest owners view so-called close-to-nature management practices. It concludes that the implementation of such approaches is not so much driven by financial incentives like subsidies , but depends on the compliance of management practices with nonmaterial values and cultural background (e.g. family traditions) held by the land owner (Bieling 2004). Therefore, CES may be seen as a starting point and most relevant argument in incentives that strive for management approaches which sustain a broad range of ES. Another important issue in this context is that CES, in contrast to most provisioning and regulating services , are typically linked to a specific place and cannot be replaced by technical or socio-economic solutions (MEA 2005). In Central Europe, the high economic standard allows to import agrarian goods from all regions of the world. Services like local recreation, sense of place or cultural heritage, however, are inextricably linked to the cultural landscapes people are attached to in their daily life–if they are not sustained in these places, they are lost (compare Guo et al. 2010 for the increased dependence on CES in economically well-developed countries).
6.5.1.4 Policy Instruments and Civil Society Initiatives for Preserving the Manifold Services Provided by Orchard Meadows
Given the manifold cultural and other ES provided by orchard meadows , political and economic instruments are critical to counter the degradation and drastic decline of these important elements of the regional cultural landscape. Unlike in other German federal states like Saxony, orchard meadows in Baden-Württemberg are not protected by specific regulatory state policies. However, orchard meadows are often either part of Natura 2000 areas, situated within nature protection or landscape protection areas, or can be found in the so-called buffer or transition zones of biosphere reserves. Outside nature protection areas, orchard meadows can be used for agricultural purposes, yet only in a nonintensive manner and in compliance with further specific nature protection regulations. Such land-use restrictions, however, are often perceived by land users as unduly intervention by state authorities. Even more importantly, these legal restrictions do not contain any obligations to carry out the necessary maintenance of the orchard meadows through nonintensive land management in a regular fashion .
To counteract the decline and increasing degradation of orchard meadows, a number of public and private funding programmes and other incentive-based instruments have been launched in recent years. These reward mechanisms–in the international scientific literature usually referred to as ‘Payments for Ecosystem Services’–provide fixed payments for land users to voluntarily carry out concrete measures, such as a specific bird-friendly pruning. In Baden-Württemberg, the state government is spending about 10 million Euros per year for direct and indirect measures for the preservation of orchard meadows (MLR 2009). While in many cases CES are positively affected by these preservation measures, they are hardly targeted directly. Promoting cultural services more directly often fails because they are much harder to grasp compared to provisioning and regulatory services as well as more difficult to link to specific forms of land management and to quantify.
Preservation of orchard meadows is mainly supported by the agri-environmental programme of Baden-Württemberg (MEKA III). Land users receive 2.50 € per tree for the mandatory management and maintenance of grassland under and between the fruit trees and for the regeneration of standard fruit trees. Other grants for the conservation and maintenance of meadow orchards, but also for planting new fruit trees are available in certain funding and project areas in the context of either land consolidation measures or the Directive on Countryside Conservation (Landschaftspflegerichtlinie) of the federal state of Baden-Württemberg. In the future, establishing and maintaining orchard meadows will be considered as compensation measures for interventions in nature and landscapes and will entitle to obtain appropriate compensation payments (so-called eco-accounts or habitat banking).
Other state-funded assistance programmes support the processing and marketing of fruits from orchard meadows in the biosphere area and beyond: This includes promoting investments in diversification measures of agricultural enterprises, for example for establishing small distilleries, but also for creating efficient networks of (juice) wineries and for the purchase of mobile juice presses and bottling machines (MLR 2008, 2009).
Other incentive-based forms of promoting orchard meadows in the biosphere reserve are initiatives where, for example, apple juice from scattered fruit trees is marketed at a premium to compensate for maintenance efforts. Here, the redemption price for the producer is higher than the current or normal price if the fruits come from orchard meadows that are managed nonintensively or even ecologically and/or that are situated in specific regional production areas. For example, in the context of the PLENUM project (which started in 2001) of the federal state of Baden-Württemberg which aims to preserve and develop nature and the environment the apple juice and liqueur brand ‘ebbes Guad’s’ was developed in collaboration with local (juice) wineries and fruit-growing associations. Here, the fruits come from about 200 ha of orchard meadows where only specific production practices are used and land users receive a premium of 3 €/dt beyond the current market price . PLENUM funds are also used to support the apple juice initiative ‘Feines von Reutlinger Streuobstwiesen’ (‘Fine fruits from orchard meadows in Reutlingen’) where land-users receive an even higher premium to adhere to additional and more stringent ecological criteria. In addition to these premium price initiatives, in the PLENUM area Swabian Alb also infrastructure measures for cider and wineries are cofinanced as well as projects promoting the integration of actors along the entire value chain (producers, processors, retailers, restaurants, and consumers) and improving public relations and fostering the education and training of orchard farmers (PLENUM 2008).
The wide range of payment and reward programmes to promote orchard meadows illustrates the increasing importance of incentive-based instruments for the conservation of cultural landscapes. This seems all the more ‘trend-setting’ since the majority of ES provided by traditional orchard meadows are public goods which are not traded at ‘free markets’. Without any doubt, the funding schemes and initiatives mentioned above have certainly provided a number of impulses for the preservation and maintenance of orchard meadows . Due to a number of reasons, however, it appears to be doubtful that the existing incentive-based instruments–both, content-wise and with respect to the financial resources available–will be able to stop or even reverse the decline and degradation of orchard meadows. For example, only 1.67 million of altogether 9.3 million scattered fruit trees in Baden-Württemberg were promoted in the framework of the agri-environmental programme MEKA III (MLR 2010).
The poor uptake of this funding instrument is caused, first, by the fact that a large part of the orchard meadows is not maintained by farmers, but by amateur cultivators who are not eligible to receive payments from EU cofinanced agri-environmental programmes . Second, the plantation and maintenance of orchard meadows are associated with high investment and production costs , which are only partly covered by the respective premiums of state-financed schemes. Third, the farming requirements that have to be met to receive payments through these schemes as well as the funding periods are often very inflexible and the measures are hardly tailored to the specifics of the regional ecosystems and farming systems.
Further, competing policies, such as schemes promoting the cultivation of energy crops , also increase the opportunity costs of managing orchard meadows and, thus, increase the land-use pressure in areas with orchard meadows (cf. Schleyer and Plieninger 2011). Finally, before the background of an increasingly rigid government spending it seems useful to make more use of private financial sources for such programmes. Here, price premium initiatives , private investments in marketing and processing infrastructures as well as compensatory payments for interventions in nature and landscapes have a high potential.
6.5.1.5 Conclusion
Orchard meadows combine many features of traditional cultural landscapes and deliver a multitude of ES. Although they were originally developed for the sake of efficient food production , today especially their cultural services are acknowledged, such as a sense of place, recreation and inspiration. But these landscapes are also subject to the comprehensive land-use trends we could observe during the last decades: intensification of production, settlement and infrastructure development on the one hand, urbanisation and land abandonment on the other (Plieninger et al. 2006) pose a threat to the survival of these meadows.
The ES approach can offer valuable perspectives in the struggle for conserving traditional cultural landscapes and in balancing different demands on land use. In order to understand the societal value of a landscape comprehensively, its cultural services must be taken into account adequately.
We introduced mapping of landscape elements which represent the cultural meaning of the landscape as a possible way of operationalising cultural services. Deliberately linking values such as recreation, identity , cultural heritage and a sense of place to tangible landscape elements may result in a stronger motivation to conserve the landscape than what could be achieved by directives and financial incentives alone. The ES concept in landscape management bears great potential for visualising the links between cultural landscapes and human well-being. Awareness -raising for the interrelation between land use and the immaterial parameters of well-being must be just as strong as it is for the material aspects in order to conserve cultural landscapes’ ES and to foster them by means of targeted policies or initiatives.
6.5.2 Calculation of Landscape Management Measures and Costs
K. Grunewald13 , R.-U. Syrbe14 and O. Bastian14
(13)
Zöllmener Str. 11 b, 01705 Freital, Germany
(14)
Leibniz-Institut für ökologische Raumentwicklung, Weberplatz 1, 01217 Dresden, Germany
6.5.2.1 Objectives and Methodology
A broad social consensus exists for the permanent preservation and development of our cultural landscapes and habitats, which expresses itself in a growing demand for biodiversity and intact cultural landscapes, as well as in the willingness to provide the financial means to do this (e.g. Hampicke 2006; Spangenberg and Settele 2010). However, in order to secure their own existence, human beings have to intervene in nature, altering it by various forms of land use. In addition to provisioning services (e.g. generation of foodstuffs and raw materials through agriculture and forestry), cultural landscapes and their ecosystems also furnish many regulation and sociocultural services . To make the broad range of ES permanently available, i.e. to ensure that biodiversity and productivity of the ecosystems are preserved, targeted landscape management is necessary, something which entails financial expenditure for society (Grunewald et al. 2014).
If we take the politically specified need for the preservation of species and habitats as contained in treaties, guidelines , laws and regulations into account (e.g. Convention on Biological Diversity, EU-Natura 2000 Guidelines, EU Biodiversity Strategy, Measures Program for Biological Diversity, etc.), then suitable measures have to be taken in accordance with the technically derived requirements. The social expenditures and costs for landscape management therefore represent an indicator of the economic valuation of ecosystems, since their existence is not secure without these performances. Apart from ethical, aesthetic and informational values, which are very difficult to determine in monetary terms, landscape management accounting as a tool for indicating the need of action to maintain ecosystems can help to negotiate the level of socially agreed demand for nature as well as the willingness to pay for nature protection. The ES approach addresses calls for incorporation of such economic valuations in ecological management decisions (Carpenter and Turner 2000; Farber et al. 2006).
Landscape management is defined as the totality of all measures for the safeguarding, maintenance and development of natural habitats for indigenous species of plants and animals, and for the maintenance and renaturalization of ecosystems and landscapes in the event of damage (Jedicke 1996). In this context, one important task is the preservation and development of ecological and landscape diversity. Landscape management is particularly concerned with the safeguarding and provision of general interest services for society (particularly regulation and sociocultural ES).
Even if appropriate databases have gradually been improved, comprehensible calculation models relating to the valuation of landscape maintenance services are not very common. However, knowledge of the magnitude of required financial resources are necessary to plan and to ensure the expenses for an extensive land management, at least in part, and/ or additional use, maintenance and development of habitats. Payments for ecosystems and benefits from ES must be considered in context (allocation options). For example, if farmers get payments for landscape conservation measures, such as the extensive use of grassland, they should have entitled only to the compensation of additional expenses or income compensation. As they are participants in the market, distortion must be avoided in favour of payments, which are justified by adequate performances and not by appropriate consideration covered subsidies .
Any investigation of the requirements for landscape management includes a comprehensive recording of landscape management objects or tasks (habitats, structures, species, as well as any existing deficits) and an estimation of the management costs (related to year, type and object). The total financial requirements consist of the costs for the management, developmental and investment measures for each type of habitat, as well as of special expenditures for the protection of particular species.
Based on approaches of LfUG (1999) and Döring (2005), we developed a methodology for a regional (state-wide) calculation of landscape management measures and costs. It was compiled in an exemplary manner for the Federal State of Saxony (ca. 18,420 km2) in Germany. ◉ Figure 6.22 illustrates the contents and the focal points of such a regional landscape management accounting system with the possibility of regional differentiation on the administrative level and on the level of the physical region (. Fig. 6.22).

The objective fields of practical action of a landscape management strategy include, above all, open-land areas, water structures, woods, as well as measures for species protection relating to object and habitat. In this context, reference must be made to the funding practices of individual countries and of the EU with regard to nature conservation and landscape management.
The data sources which could be used for the creation of a landscape management accounting system are of varying quality (survey status, regionally different mappers, etc.). This applies to the whole analytic section of the landscape management accounting, which is based on facts and assignments. Consequently, error margins and uncertainties have to be taken into account in the overall context. However, the results were verified using both data obtained from literature and alternative approaches (in particular expert knowledge), and may be regarded as generally reliable, as well as providing a sufficient level of accuracy for the purposes of the landscape management accounting system (Grunewald and Syrbe 2013).
The first step in the frame of the methodology is the mapping of management-relevant habitat types of a region or of a country as “regional scenario of habitat types, which are relevant for the landscape management” (groups of habitat types, see Grunewald et al. 2014):