International Trade in Manufactured Goods
Chapter 4
International Trade in Manufactured Goods
Mary R. Brooks*
1. Introduction
Shipping, on the scale we see today, would not exist were it not for globalisation, and the evolution and restructuring of the world’s economies after World War II. The increasing specialisation of the world’s economies, and the desire for goods or food made or grown elsewhere, along with increasing urbanisation, has altered the demand for transport. In this chapter, the focus will be on global trade in manufactured goods and the role that shipping plays in this market.
Cargo transported by ship falls into two broad categories – bulk and unitised. The former usually travels via tramp vessels and includes both liquid bulk – mostly crude oil and oil products – and dry bulk, the largest of these being iron ore, grain and coal. As the ocean transport of unitised cargo is the subject of this chapter, bulk cargoes will only be discussed where it is necessary to supply context.
In the bulk sector, the world of shipping has followed a traditional growth pattern. Based on tonne-miles, crude oil, oil products and dry bulk commodities are the most important trades in ocean shipping (Figure 1). Unitised cargo (predominantly containers, and included in other in Figure 1) is not dominant in terms of tonne-miles demanded; it accounted for 25 to 28% of tonne-mile demand in the 1990s, up from 19.9% in 1970, and it continued to grow in importance until 2007.1
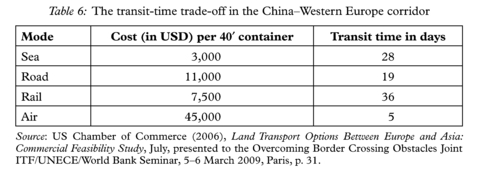
However, shipping demand in tonne-miles is only one measure of importance. In value terms, trade in manufactured goods drives world prosperity, as manufactured goods account for about 70% of world trade in value terms. This chapter provides an overview of world trade in manufactured goods, the primary user of containerised liner shipping. It begins by identifying the key manufactured goods traded globally, the leading trading nations and the accompanying trade flows. As air cargo is the principal competitor of maritime transport for inter-regional trade in manufactured goods, the role of air cargo is examined briefly. To complete the picture, the trader’s view of shipping as a mode choice is discussed and conclusions drawn about what the future may hold for the transport of manufactured goods.
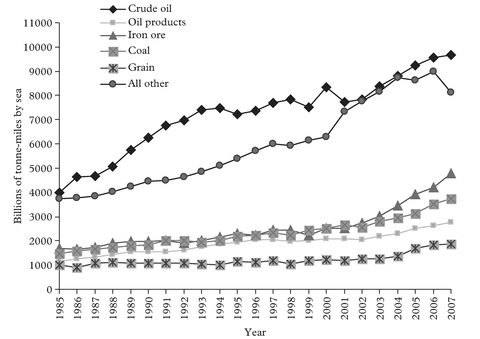
Source: Created with data cited by UNCTAD (2009), Review of Maritime Transport 2008, Table 5, p. 15 and equivalent tables from prior years’ editions.
2. The Key Manufactured Goods Traded Globally
The world in the early days of general cargo shipping looked nothing like the world of trade today. The heyday of trade in tea and silk financed by opium sales to China is long gone. By 1900, China’s imports had become more diversified, with cotton goods and yarn replacing opium. While tea and silk may have been China’s key exports to Europe in 1870, by 1890 they too had diversified, giving way to shipments of seeds, oil, beans, hides and “all other items” on the westbound leg from Asia.2
Product development departments 40 years ago were only beginning to contemplate many of the manufactured goods critical to business today, such as personal computers, mobile phones and wireless devices. However, post-war consumerism was well-established by the late 1950s when Malcolm McLean, in an effort to address inefficiencies in goods transport, conceived the seminal idea of what has now become containerisation. In 1956, he shipped the first “boxes” (really truck chassis) on the Ideal-X from New Jersey to Houston, irrevocably changed the way most manufactured goods are transported3 and laid the foundation for the next wave of globalisation. Mattel’s “all-American” Barbie, to use one of Levinson’s insightful illustrations, was anything but all-American; her plastic body, clothes and hair all came from various factories in Japan, Taiwan and China.4 Barbie was conceived in 1959 and this inexpensive item, relatively speaking, could withstand the cost of transport, be made half-way around the globe and still be affordable for a generation of female baby boomers. Transport costs had been dropping steadily since the end of World War II, and no longer offset the cost advantages of Asian labour. Asia continued to compete on wages and became the heart of the manufactured goods sector over the balance of the century. From 1985 to 1990, the average annual growth in containerisable trade on North America/Far East and Far East/Europe trade legs exhibited double-digit growth rates and, after a brief slowdown in the early 1990s, growth in trade production in many Asian nations resumed its former pace. Since then, the rate of growth in merchandise trade has consistently outstripped the rate of growth in world GDP and commodity output.
According to the World Trade Organisation (WTO), trade in manufactured goods accounted for 74.9% of all merchandise exports by value in 2000, significantly higher than the 70.5% recorded in 1990.5 It included iron and steel, and chemicals, both of which may be carried as bulk commodities, although the chemicals make up a significant component of containerised trade. If these two categories of manufactured goods are discounted, the remaining manufactured goods still made up 63.3% of merchandise exports by value in 2000. Then, by far the largest category of internationally traded manufactured products in 2000 was machinery and transportation equipment, even after the highly visible automotive category was extracted. The WTO reported that growth in 2000 was 6% in manufactured goods, 14.5% in manufacturing exports and only 4% in world GDP.6 Much of the 1990s’ growth had been driven by enhanced labour productivity. However, growth in global sales for office equipment and production machinery was expected to slow, if not stagnate, as the technology revolution completed its restructuring of both the office environment and the shop floor. The growth for the 2000–2007 period was 7.5% in manufactured goods and the forecast for the office and telecom equipment sub-sector had been realised as it was the slowest growing of all export sectors reported.7
In 2006, the WTO discontinued reporting machinery and transportation equipment exports separately so Figure 2, which reports the latest available 2007 data, includes this traded good in the Others (semi and manufactures) category. The decline seen for office and telecom equipment was also reflected in other manufactures, although not to the same extent, as the exceptional rise in energy and commodity prices (and hence the fuels and mining products sector) over the seven years took a significant bite out of the share held by most manufactured goods.8 The share of manufactured goods in world merchandise exports has declined a full 5% since 2000.
As the 2008 data have not yet been released by the WTO, the impact of the economic downturn on the mix of trade is not yet known but is anticipated to be much worse as US and European consumers slowed their spending on consumer goods and energy prices hit a 30-year high in the summer of 2008.
Looking ahead, the world continues to move towards a service economy and, in general, service production activities do not use sea transport. Job growth is in economies and industries that do not contribute to shipping tonne-miles – software, pharmaceuticals, education services, bio-technology, eco-tourism and leisure recreation, and business services. The conversion of world trade from predominantly goods-led to service-led growth is mostly complete.
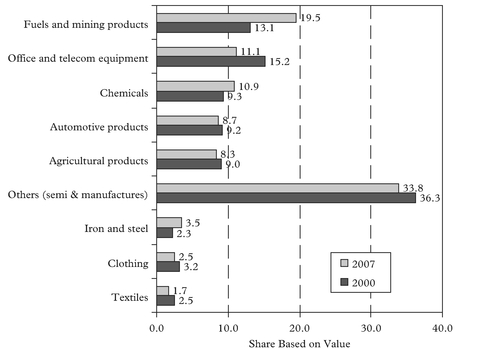
Note: ‘Others’ includes machinery and transport equipment but excludes both office and telecommunications equipment and automotive products.
Source: Created from data provided by World Trade Organisation (2002), International Trade Statistics 2001, Table IV.1, p. 95 and World Trade Organisation (2008), International Trade Statistics 2008, Table II.2 from www.wto.org
3. Who are the Leading Traders?
As already noted, export growth in the 1990s was phenomenal in Asia and this continued throughout the economic recovery in the post-2001 period. North American trade was disappointing, as it did not grow at a rate approaching that of Western Europe, let alone Japan and the developing countries of Asia. By 2007, the top 10 world traders are all, with the exception of China, members of the Organisation for Economic Co-operation and Development (Figure 3).9 Belgium and its neighbour the Netherlands are key gateways for Europe’s trade in manufactured goods, supporting Germany’s role as the world’s second largest consumer and the leading goods producer.
Since the late 1990s, the four BRIC countries – Brazil, Russia, India and China – have captured the imaginations of trade observers and warrant closer attention. While the exports of Brazil have grown at an annual average rate of 17% since 2000, the country ranked twenty-fourth in exports still only accounts for just over 1% of global trade and has not yet recovered its 2% share of world merchandise exports recorded in 1948. More important, Russia’s growth 2007 over 2006 was similarly dramatic; Russian exports
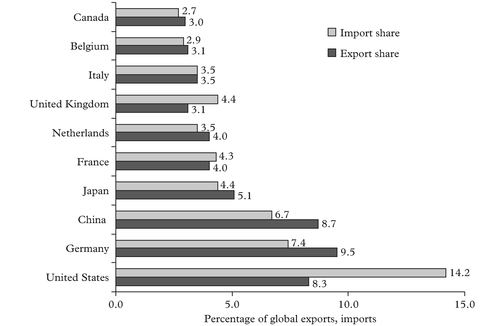
Source: Created from data provided by World Trade Organisation (2008), International Trade Statistics 2008, Table 1.8, p. 12 of World Trade Developments section.
grew at 17% over the previous year, moving it to twelfth place among exporters while imports grew 36% over the previous year, to confer the rank of sixteenth. However, both countries continue to play significant global roles in supplying energy, raw materials and food, with manufactured goods being of less importance. India, like Brazil, accounts for just over 1% of global trade and it too has not recovered its post–World War II prominence; it is currently ranked twenty-sixth in merchandise exports, playing a substantial role in IT, office and telecom products. China has been outstripping these three. Since 2001, China’s export trade has grown by four times. Its growth has been sufficiently fast to wedge it into the top 10 traders, firmly in third place after the United States and Germany by the end of 2007 in terms of total trade, and in second place from an export perspective.10 In 2008, Paul Bingham presented Global Insight’s conclusions that the top four countries with the capacity to buy global products (measured in terms of GDP rank in real dollars) by 2050 will be China, the US, India and Japan, in that order.11 Brazil and Russia will be in the Top 10. Therefore these countries, and others in close proximity, may well benefit from the transportation demands such growing wealth and resultant spending on consumer goods will encourage.
Before drawing any conclusions about geographic interests in the trade in manufactured goods, and what that might mean for those with an interest in shipping, it is important to examine the major trade flows of manufactured goods and how much of
that trade is intra-regional. Throughout the last two decades, trade liberalisation and the development of the World Trade Organisation as a multilateral forum to encourage such liberalization, when coupled with the global restructuring of supply chains, encouraged intercontinental trade growth. However, the 1980s and 1990s also bore witness to an explosion of regional trade agreements – the European Single Market and the subsequent broadening of the European Union; the Canada–US Trade Agreement and later the North American Free Trade Agreement; Mercosur in South America–encouraging continental trading patterns. By the end of the 1990s, approximately half of world trade was intra-regional.
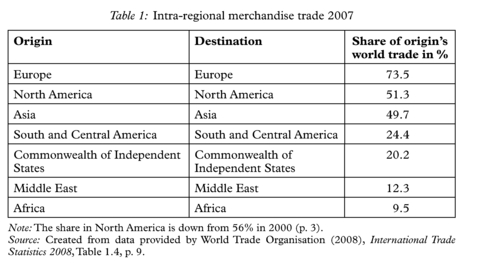
The seven regional trade flows in manufactured goods presented in Table 1 account for a significant share of world trade. As shipping best supports intercontinental and inter-regional trade, rising intra-regional trade has a dampening effect on growth in shipping demand. The intra-regional flows of the three largest trade blocs (Europe, Asia and North America) are particularly significant, and account for about half of all trade in manufactured goods. The most integrated market is Europe, with 73.5% of its trade classified as intra-regional.
“[T]rade flows within regions account for a higher share of world trade than flows between regions. Since 2000, this share has fluctuated from between [sic] 55 to 58 per cent. Relatively large differences have occurred in the growth of trade within regions: North America and Asia show a relative [sic] balanced growth between inter- and intra-regional trade; Europe’s intra-trade is growing much faster than its external trade due to the deepening of its economic integration while South and Central America, Africa, the Middle East and the CIS have recorded higher growth in inter-regional exports than in intra-regional.”12
Should the trend of trade integration continue along its current path, a prospect not unlikely given US preoccupation with homeland security and its focus on tighter border controls (resulting in a greater administrative burden), how much trade growth will
be available for ocean transport? The likely answer is a smaller share than is now available. In other words, any rise in protectionism will dampen the demand for shipping more so than already seen from the economic downturn.
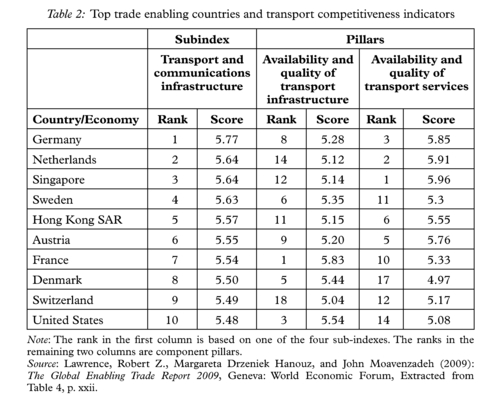
This then raises the question of how focused countries are on supporting their future trade to take advantage of global trading opportunities. The World Economic Forum has undertaken to assemble a new report on this issue. The Global Enabling Trade Report assesses factors, other than tariffs and quotas, that become barriers to trade, such as border administration, infrastructure, logistics and the business environment traders must contend with in the foreign market. Four indices are created (Table 2) based on nine “pillars” that encourage the development of trade,13 of which two reflect strong transportation competitiveness inputs (Table 3).
If the top 10 trading nations by value in