International Logistics Strategy and Modal Choice
Chapter 34
International Logistics Strategy and Modal Choice
Kunio Miyashita*
1. Introduction
The container shipping mode of transportation has in large part cooperated with, but has also competed against, the air transportation mode. The concepts of both total distribution costs and the opportunity cost support a division of labour by the two modes (air and sea) and explain the existence of a competitive grey zone. However, traditional theory is not sufficient to explain a recent trend towards air-oriented cargo flows. The modal choice problem is not in the sole domain of the transport field, but has a new dynamic dimension, which involves integration with both logistics strategy and the supply chain management of shippers. This chapter brings insight into the traditional economic phenomenon of modal choice and its innovative research frontiers related with the logistics strategy.1
The interaction between the shipping and air modes of transportation has been dominated by a trend towards air-oriented transport,2 if observed from the point of view of the value of trade volumes. Needless to say, in terms of total volume as measured by weight-tonne, sea shipments are responsible for more than 99% of total international physical distribution. Hence, the shipping industry plays a core status role in the international transport industry. However, in terms of value of the goods shipped, the share of industrial goods transported by air has increased significantly.3
Traditionally, the principle of total cost based on the difference in the service quality between the two modes of transportation has explained modal choice.4 This view is important even today. However, a point has been reached where it has become necessary for a new analytical angle based on logistics theory to be combined with the aforementioned traditional argument. In other words, there is a need for a greater level of entrepreneurial spirit in the shipping industry, especially in relation to container shipping and air transportation, which supports the logistics activities of the shipper. In this chapter, we discuss a hypothesis in which structural change in both shipping and air transportation modes will be derived according to the international logistics strategy of shippers. The core problem of modal choice will be closely related to a shippers’ logistics strategy, under which international direct investment, the product cycle and the stability of international transactions will generate a rational causal relationship with modal choice. In accordance with a shipper’s logistics strategy, international physical distribution markets will be composed of both sea and air-based logistics systems. Both of these types of system will either compete or cooperate, so that the modal choice problem of transport is gradually absorbed into the logistics system.
2. Competition and Cooperation of Container Shipping and Air Transportation
2.1 Total distribution cost as the criterion of modal choice
The higher the value of a good is, the faster the speed of the transport mode being selected will be. This is the reason why inventory costs will fluctuate in proportion to both the price of goods and the transportation period. Hence, it is preferable to transport high value goods by the speedier air-based mode to reduce the transportation period (inventory period), if the saving rate of the inventory cost is higher than the increased rate in the transportation cost. The sum of these two costs is referred to as the total distribution cost. In this case, the total distribution costs relating to high value goods will be decreased if a high-speed mode is utilised. The establishment of the concept of total distribution cost is very important in terms of determining modal choice between container shipping and air transportation. It is the concept of distribution costs that has led to the transport of high value goods by air since the 1960s.
According to the concept of total distribution costs, the value of a good is negatively correlated with the transport period. As is commonly known, if we select the transport period as the measure of the horizontal axis and total distribution costs as the measure of the vertical axis, a downward convex total distribution curve can be generated. On the contrary, if we select the value of the good instead of the transport period as the measure of the horizontal axis, an upward convex total distribution curve will be generated as shown in Figure 1.
In Figure 1, the total distribution cost curve for container shipping intersects with the cost curve for air transportation at the value of the product e. If the value of the product is greater (more expensive) than e, it will be advantageous to transport a particular product by air, and vice versa. Hence, it can be hypothesised that a division of labour between the two modes can be confirmed at e. In addition, the higher the value of the product, the higher the opportunity cost will be for products transported by container shipping. If a seasonal product, such as a currently fashionable good, is transported by the sea mode, large scale, temporary opportunity costs will be generated. In this case, the opportunity cost will increase in a greater proportion to the value of product as indicated by curve  If we add opportunity costs to the total distribution cost of container shipping, a new interactive point (intersection) indicating the total distribution costs of air transport can be realized at/, which is located to the left of the existing point e.
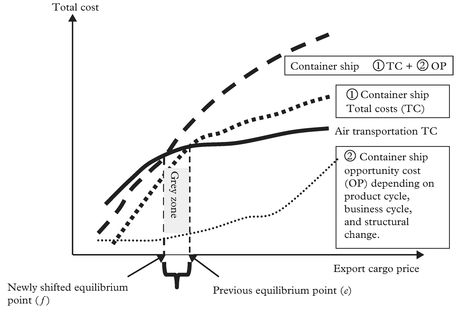
Thus, it is possible to discriminate between three kinds of value ranges for a particular product:
- Shipment by container is the logical modal choice if the value range of a particular product is lower than f;
- Air transportation is the logical modal choice if the value range of a particular product is greater than f; and
- A value range between e and f indicates a ‘grey zone’, where modal choice is extremely competitive.
The relationship in terms of modal choice between container shipping and air transportation is in principle complementary but if it is considered from a total distribution cost point of view, it will be competitive.
2.2 Turning point in modal choice
Recent Japanese export trade volume data in Figure 2 shows that between 1980 and 1992 existed a parallel relationship between the export share of goods transported by container shipping and the share of goods transported by air transportation.
The share of goods shipped by air transportation increased steadily as new markets were exploited, while container shipping continued to maintain its share of the conventional liner shipping business. However, after reaching a plateau in 1992, container shipping gradually began to lose share relating to export transport. Since 1992, modal share has fluctuated in a downward direction. In 1992, container shipping was responsible for 52% of all export shipments. By 1998, this share had decreased to 47%.
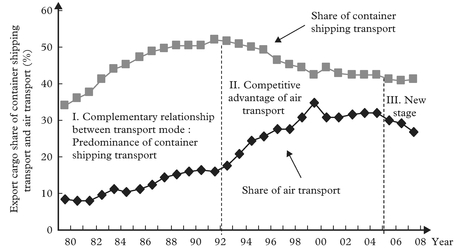
Figure 2: Development of trade by air in Japan: competitive and complementary relationship with container shipping
Source: Ministry of Finance Japan
On the contrary, in 1992, the modal share for air transportation was 18%. This had increased to 29% by 1998.
Thus, it appears that 1992 can be considered to be the turning point in share fluctuation between the two modes in the case of exports from Japan. It should be noted that it is the shipper who has changed the international physical distribution strategy. In addition, the modal choice problem has structurally changed since 1992 in Japan. Generally speaking, it is necessary to generate a different model of modal choice for the period before 1990 as opposed to model considered representative of the 1990s.5
2.3 Modal choice model prior to 1990
Before 1990, the principle of total distribution costs dominated the modal choice behaviour of shippers. Following, the principal and complementary relationship between two modes will be determined. As shown in Figure 1, opportunity costs will generate a competitive grey zone. In this case, it can be hypothesised that while air transport service is not a superior good, a container shipping service cannot be considered to be an inferior good. If this is indeed the case, the question of which type of modal service will be preferred by shippers remains to be answered, especially if the income (revenue, profit) of a shipper determines modal choice.
Accordingly, the modal choice activity function will be noted as follows.

where:
ETA = value of export trade volumes by air transportation,
ETS = value of export trade volumes by container shipping,
TCA = total distribution costs by air transport,
TCC = total distribution costs by container shipping,
GDP = gross domestic product of export country,
OPC = opportunity cost of container shipping,
TAS = preference by shippers for freighter, and
i = specific time point.
The data for the variables ETA, ETS, GDP and TAS are readily available in each of the countries under study. An approximation of total distribution costs can be determined hypothetically by calculating the reciprocal of freight share as measured by commodity price/freight rate. This type of approximation is only available if the ratio of container freight rate in container cargo price is constant or in other words its technological progress is comparatively stable6.
In equation (1), the dependent variable (the ratio of trade volumes between air transportation and container shipping) will fluctuate in a reverse direction as compared to the ratio of the total distribution cost between the two modes, if their respective transport services are both substitutive and competitive. In this case, the sign of the ratio representing total distribution costs will be negative. However, if the trade volume ratio fluctuates in the same direction as the total distribution cost ratio, both transport modes will possess a complementary relationship. In this case, the sign of the total distribution cost ratio will be positive as per our hypothesis.
Next, we assume that as the GDP of an export country increases, its trade volume ratio will increase. Thus, the sign of the GDP ratio will be positive. In this case, an increase in the GDP of a particular country will lead to an increase in air transport volumes, which represents the numerator in the trade volume ratio. Hence, air transportation service can be classified as a superior good with container shipping service representing an inferior good. On the contrary if the sign of GDP ratio is negative, air transportation service can be classified as neither a superior or inferior good.
In general, the opportunity cost of container shipping will have a positive sign, because the total distribution cost of air transportation will lead to cost advantages over container shipping. The preference by shippers for freighter will likely increase the share of trade volume flows by the air transportation mode, so it can be assumed that its sign will be positive.
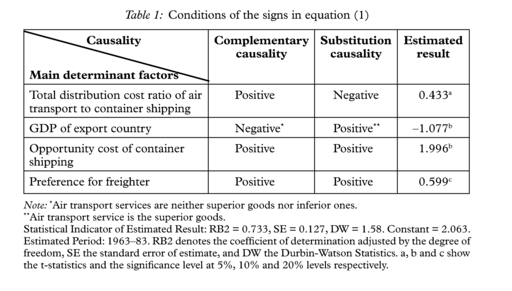
For Japan, the signs of the variables in equation (1) and the estimated results of the equation are summarised in Table 1. Equation (1) is specified in the logarithmic form and is estimated by the least square method.
The estimated results with respect to the sign of the coefficient indicate a complementary relationship between air transport and container shipping. The coefficients of both the total distribution cost ratio of air transport to container shipping and the GDP of the export country (Japan) are statistically significant and demonstrate a complementary causality. At the same time, the basic relationship is influenced by both the opportunity cost of container shipping and the preference for the shipper to freighter, which leads to the existence of a competitive zone, which we refer to as a grey zone.
2.4 Increases in substitution causality in the 1990s
Next, we expand the estimated period to cover the years 1980–1996. In the 1990s, in addition to the total distribution cost ratio of air transport to container shipping, the function of the logistics network is also a determinant factor. Such network effects, as represented by foreign direct investment, will absorb the traditional function of opportunity cost, income and preference on a shipper’s modal choice behaviour. Direct investment will determine the shipper’s international logistics strategy to the extent that the existing simple modal choice mechanism will no longer be appropriate due to the structural change in the network effects. The function is thus adjusted as follows:

where:
DIU = direct Japanese investment in the US
DIE = direct Japanese investment in the EU and
DIS = direct Japanese investment in Asia.
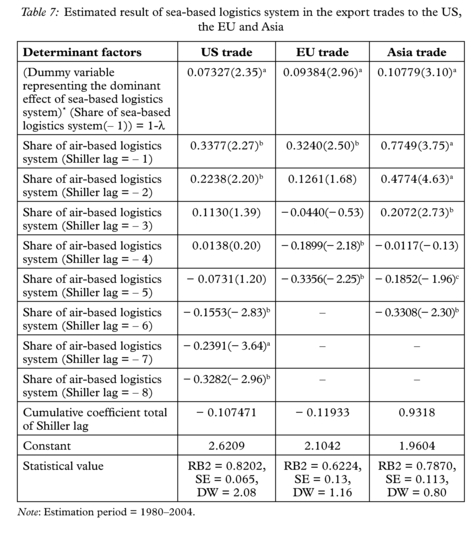
Equation (2) is specified in the logarithmic form and is estimated by least square method as in equation (1). The estimated results are detailed in Table 2.
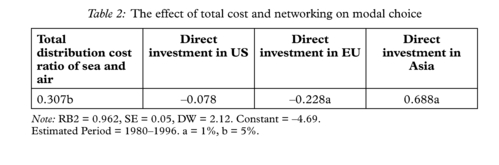
The estimated results of the total distribution cost ratio as detailed in Table 3 suggest a fundamental complementary relationship between air transportation and shipping. However, the effects of direct investment on modal choice vary considerably. The sign representing the coefficient of direct investment in Asia is positive, indicating that the shipper regards air transport as the superior good. In the Asian region, the substitutive nature of air and sea services are clearly indicated. However, direct investment in the EU strongly indicates the complementary nature of the services. Finally, the coefficient representing direct investment in the US is not statistically significant. Thus, the network function as related to air transportation and shipping services is neither complementary nor substitutive. In the Pacific region, the effect of service quality on modal choice is neutral.