Intellectual Property and Corporate Value
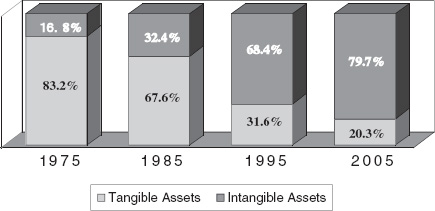
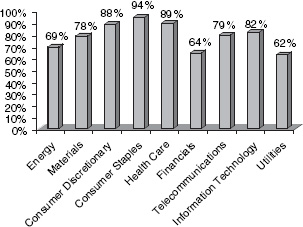
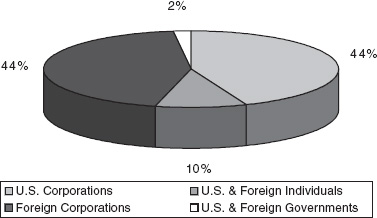
Chapter 1 In the last thirty years, intellectual property (IP) and intangible assets have become the dominant assets of major corporations. These assets are at the heart of competitive advantage. They are the foundation of new product categories and sometimes entirely new industries. They differentiate products, provide unique utility, and even permeate products and services with cachet. Often, they allow the manufacturer to obtain a premium price for an otherwise ordinary item. Other times, they provide the user with substantial cost savings. Ocean Tomo is an integrated, intellectual capital merchant bank.1 It conducted an analysis of the largest companies in the United States and found that patents, trademarks, copyrights, and other intangible assets have exploded as a percentage of the S&P 500’s market value, from seventeen percent in 1975 to eighty percent in 2005 (see Exhibit 1.1). No longer do markets value companies based on balance sheet cash and fixed assets. Today, stock prices reflect the importance and value of all intangible assets, including patents, trademarks, copyrights, and trade secrets. This is supported by a recent Les Nouvelles article, where the value of IP and intangible assets, as a percentage of corporate market value, is reported as the exact same value shown by Standard and Poor’s index.2 The article shows that the dominance of intangibles is not solely associated with high technology companies, but rather holds true for a diverse selection of industries. For many industries, the dominance of IP is easy to understand. Healthcare, telecommunications, and consumer discretionary products would be expected to possess high amounts of technology or trademarks. Some industries, like utilities, would not be expected to have such intangible asset dominance, yet it turns out that all industries currently rely on a significant amount of IP and intangible assets (see Exhibit 1.2).3 A patent for an invention is the grant of a property right to the inventor, issued by the United States Patent and Trademark Office (USPTO). Generally, the term of a new patent is twenty years from the date the application for the patent was filed in the United States or, in special cases, from the date an earlier related application was filed, subject to the payment of maintenance fees. U.S. patent grants are effective only within the United States, U.S. territories, and U.S. possessions. Under certain circumstances, patent term extensions or adjustments may be available. The right conferred by the patent grant is, in the language of the statute and of the grant itself, “the right to exclude others from making, using, offering for sale, or selling” the invention in the United States, or “importing” the invention into the United States. What is granted is not the right to make, use, offer for sale, sell, or import, but the right to exclude others. Once a patent is issued, the patentee must enforce the patent without the aid of the USPTO. There are three types of patents: As more products incorporate many diverse technologies, there will continue to be more opportunities to enjoy the economic benefits of licensing. There will also be more need for licensing, so that the companies pursuing commercialization of technology will be able to enjoy freedom to operate, without the threat of infringement litigation. Consider, as an example, the ubiquitous personal digital assistant (PDA). The diverse proprietary technologies incorporated into PDAs includes inventions associated with Few companies possess all of the diverse technologies incorporated into today’s products, so licensing technology is becoming fundamental to product creation. In 1974, the number of utility patents granted was 76,278. By 2004, the number of patents granted more than doubled, to 164,293. Corporations were granted the vast majority of patents in 2004; foreign and domestic corporations received eighty-eight percent of the total number of patents granted. Interestingly, forty-four percent of patents are owned by U.S. corporations and forty-four percent are owned by foreign companies. Foreign and U.S. individuals combined received ten percent of all patents, with the remainder going to U.S. and foreign governments. The 2004 distribution of patent ownership has remained largely unchanged for the past ten years (see Exhibit 1.3). Most patents are owned by U.S. and Japanese companies. The top ten foreign owners of U.S. patents are Japan, Germany, the United Kingdom, France, Canada, Switzerland, Taiwan, Italy, Sweden, and South Korea. Source: U.S. Patent and Trademark Office
Intellectual Property and Corporate Value
PATENTS
Patent Trends
Who Owns the Most Patents?
| Company | Number of Patents |
| IBM | 42,591 |
| General Electric | 31,293 |
| Canon Kabushiki Kaisha | 28,202 |
| Hitachi | 26,369 |
| Toshiba | 22,888 |
| NEC | 17,626 |
| Eastman Kodak | 19,780 |
| Matsushita Electric Industrial | 19,611 |
| Mitsubishi Denki Kabushiki Kaisha | 18,985 |
| Sony | 17,604 |
| Motorola | 17,541 |
| Siemens AG | 17,095 |
| US Philips | 16,229 |
| AT&T | 16,130 |
| E. I. DuPont De Nemours | 15,385 |
| Fujitsu | 15,176 |
| Fuji Photo Film | 15,044 |
| Xerox | 14,743 |
| Bayer AG | 13,930 |
| US Navy | 13,408 |
Technology Classifications
Between January 1977 and December 2004, over 3.1 million patents were granted. At this writing, the total number of patents granted for all time was nearing 7 million.
The USPTO classifies patents by technology category. Technology classifications for which patenting is most active are shown in Exhibit 1.4.
EXHIBIT 1.4 U.S. PATENT TECHNOLOGY CLASSIFICATION
Source: United States Patent & Trademark Office.