Globalisation – The Maritime Nexus
Chapter 2
Globalisation — the Maritime Nexus
Jan Hoffmann* and Shashi Kumar†
1. Introduction: Globalised Business in a Globalised Economy
“Globalisation” means different things to different people. For some, it is the raison detre for poverty and global financial crisis; for others, it is a sine qua non for economic development and a rise in standard of living. Even “When did globalisation begin?” (O’Rourke and Williamson, 2000) is a disputed topic. For us, in this chapter about maritime economics, it is simply a concept that describes a trend in international trade. It means (a) that trade is growing faster than the world’s GDP; and (b) that this trade is not only in finished goods and services, but also increasingly in components and services that are used within globalised production processes. Maritime transport is growing because it is required to move traded goods and components, and trade in maritime services is itself taking place on an ever more global scale.
Transport is one of the four cornerstones of globalisation. Together with telecommunications, trade liberalisation and international standardisation, the increased efficiency of port and shipping services has made it even easier to buy and sell merchandise goods, raw materials and components almost anywhere in the world. International standards and homogenous products foster global competition. Trade liberalisation allows the efficient international allocation of resources. Finally, telecommunication and transportation are the necessary tools to transfer information and goods. “Despite all the headlines and political bluster surrounding the World Trade Organisation, NAFTA and other trade pacts, the real driving force behind globalisation is something far less visible: the declining costs of international transport” (The Journal of Commerce, 15 April 1997).
At the same time, maritime business itself is probably the most globalised industry. Most maritime transport is provided between two or more countries, and the service providers no longer need to be nationals of the same countries whose cargo they move. In fact, a simple commercial transaction may easily involve people and property from a dozen different countries: A Greek-owned vessel, built in Korea, may be chartered to a Danish operator, who employs Philippine seafarers via a Cypriot crewing agent, is registered in Panama, insured in the UK, and transports German made cargo in the name of a Swiss freight forwarder from a Dutch port to Argentina, through terminals that are concessioned to port operators from Hong Kong and Dubai. International standardisation, an important component of globalisation in general, also affects shipping: without standardised containers globalised shipping and intermodal networks would not be possible. Equivalently, international operators are now in a position to take a concession of a container terminal located in any port in the world, suppliers of port and ship equipment produce and sell globally, and ISO and IMO standards concerning quality, safety and training apply equally on all international waters.
The remainder of this chapter will look at the mutual relationship between maritime business and globalisation. Section 2 discusses how trends in international maritime transport affect globalisation, and section 3 looks at the same relationship, but from the opposite direction, i.e. how the maritime business is affected by globalisation. Section 4 provides summary and conclusions.
2. Maritime Transport and its Relevance for Globalisation
2.1 Global trade, and how it is being moved
2.1.1 The share of the maritime mode of transport
Shipping continues to be the dominant mode of transport for international trade. World seaborne trade has grown almost continuously since World War II, with tonne-miles increasing more than three-fold since 1970 (UNCTAD, 2009).
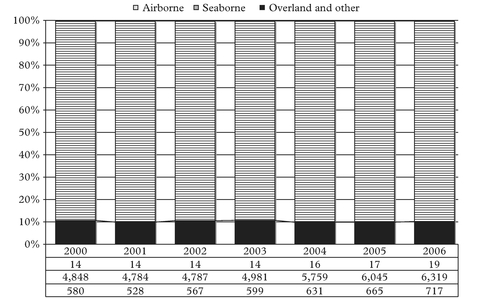
Seaborne trade accounts for 89.6% of global trade in terms of volume (tonnes) and 70.1% in terms of value. Airborne cargo has a share of just 0.27% of trade volume and 14.1% of trade value, whilst overland and other modes (including pipelines) account for the remaining 10.2% of volume and 15.8% of trade value (See Figures 1 and 2). In 2008, total world seaborne trade, including intra-European Union trade, is estimated to amount to about 8.17 billion tons (UNCTAD, 2009).
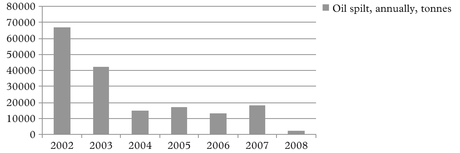
The shares of the different modes tend to remain stable in terms of volume, but fluctuate much more when analysing the trade value. During the seven years 2000–2006, the share of seaborne trade volume has fluctuated only between 89.04 and 89.82% (a range of 0.78 percentage points), while its share in trade value fluctuated seven times more – between 64.48 and 70.07% (a range of 5.59 percentage points). The main reason for those differences lies in the fact that the share in trade value is strongly influenced by the price of the traded commodities. In particular, the rising price of oil, but also that of other commodities, has contributed to the rise in the share of sea-borne trade – albeit only its value and not its volume. Another trend that leads to an increase in the share of maritime trade value is the changing composition of global maritime trade, which includes increasingly manufactured and intermediate goods.
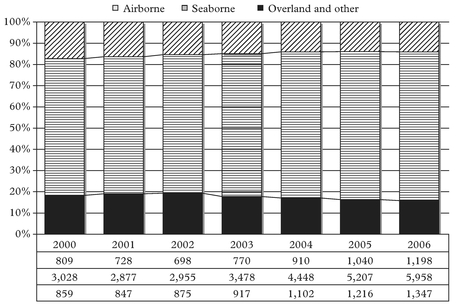
Source: Global Insight, not inlcuding intra-European Union trade
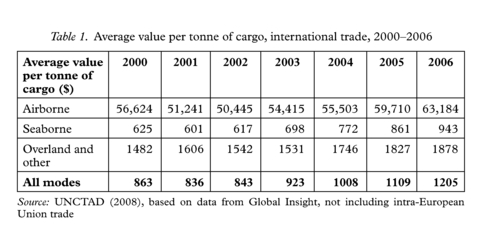
As regards the unit values by transport mode, in 2006, the average value per tonne of cargo of seaborne trade was $943, versus $63,184 per tonne of airborne trade and $1,878 per tonne of trade transported overland or by other modes, such as pipelines (Table 1). In other words, a tonne of airborne cargo was on average 67 times more valuable than a tonne of seaborne cargo.
2.1.2 The geography of seaborne trade
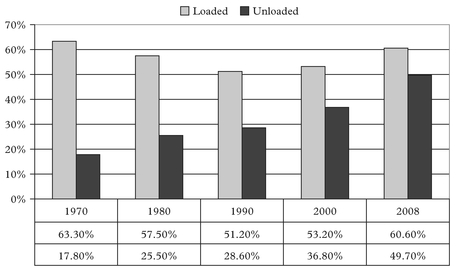
The major loading areas for seaborne trade today are developing regions (60.6%), followed by developed economies (33.6%) and countries with transition economies (5.9%). Asia’s share of seaborne exports is 40%, followed in descending order by the Americas, Europe, Africa and Oceania (UNCTAD, 2009).
Figure 3 reflects the evolving participation of developing countries in global imports and exports. In 1970, developing countries still imported mostly high-value/low-volume manufactured goods and exported above all low-value raw materials; as a result, they exported almost four times as many tonnes of seaborne cargo than they imported. Today, developing countries participate much more in globalised production processes. Especially China, India and other Asian countries have become important importers of commodities such as iron ore, bauxite and grains, while at the same time increasing their share in manufactured exports. This is an interesting trend, as it illustrates that the classical distribution of trade between developed and developing countries is no longer valid.
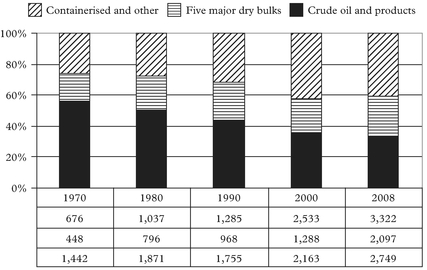
2.1.3 The composition of seaborne trade
Approximately two thirds of seaborne trade are dry cargoes and one third liquid bulk (Figure 4). Dry cargoes are increasingly being carried in containers. The majority of containerised cargo is made up of manufactured goods and high-value bulk commodities, such as time- and temperature-sensitive agricultural products. Since 1990, containerised trade has increased by a factor of five – an average annual growth rate of almost 10%. In 2008, global container trade was estimated at 137 million TEUs (UNCTAD, 2009).
Source: UNCTAD, Review of Maritime Transport 2009, Geneva, 2009
Source: Authors, based on data from UNCTAD, Review of Maritime Transport 2009, Geneva, 2009
Although maritime transport has historically been associated with the carriage of high-volume low-value goods (e.g. iron ore and coal), the share of low-volume, high-value containerised trade has been growing continuously since the container was invented half a century ago. Today, manufactured goods account for over 70% of world merchandise trade by value. They include consumption goods as well as intermediate goods, parts and semi-finished products that have expanded in tandem with intra-company trade, international outsourcing and globalisation.
2.2 Trade and transport in economic theory
2.2.1 International trade and economic growth
Allowing and facilitating trade has obvious positive impacts on economic growth. If Chile can produce bananas only under glass, and Ecuador can grow grapes only on an inaccessible highland, then both countries’ populations can eat more bananas and grapes (i.e. achieve measurable economic growth) if they specialise and trade – as long as the shipping services are less expensive than the savings in production costs.
Going a step further, even if one country could produce both commodities with less land or manpower than the other country, according to David Ricardo’s (1817) theory of the comparative advantage, it still makes sense for both countries to specialise and trade. Ricardo’s example uses the production of cloth and wine, where Portugal has an absolute advantage concerning both: It needs 80 man-months to produce X litres of wine and 90 man-months to produce Y metres of cloth, whereas England needs 120 and 100 man-months respectively. England has a comparative advantage concerning cloth, and a rational decision of Portugal and England will imply that the first specialises in growing wine and the latter in producing cloth, consequently leading to English exports of cloth to Portugal and Portuguese exports of wine to England. This type of specialisation, and thus also the resulting trade, can partly be explained by the “Factor Proportions Model”, which was developed by Eli Heckscher and Bertil Ohlin in the 1920s (Ohlin, 1933). This model expands Ricardo’s basic version by including differences in the endowment of resources. Linking both models thus allows to explain trade flows by differences in available technology, capital, manpower and natural resources.
Today, the academic discussion on why and how much countries trade with each other is far developed. The impetus for new trade theories came from the limitations of the classical models because of their relatively simplistic assumptions and also their empirical weaknesses. This was illustrated by the Leontief Paradox (1953) when the Factor Proportions Model, discussed earlier, was applied to the US. The empirical analysis did not support the theory’s prediction that a nation’s abundance in a particular factor of production would dominate its exports. New contributions in the post-World War II era include Vernon’s product life-cycle theory of the mid-1960s, the new trade theory of the 1980s (Krugman, 1981; Lancaster, 1980) and Porter’s (1990) national competitive advantage trade theory. The product life cycle theory explained the international trade patterns of the 1960s when the US dominated the global economy and most new products originated in that country (Vernon and Wells, 1986). As demand for the product increased gradually in other developed nations, it was initially met through US exports until the production itself moved to those countries because of higher US labour costs. Furthermore, once the product became standardised, US production was typically replaced with exports from other developed nations first and, in the long-run, exports from developing countries. However, the limitations of this theory are far too many in the contemporary global economy where production is dispersed to different parts of the world simultaneously and no one particular nation is in a position to claim hegemony in international trade.
The new trade theory is based on the increasing returns to specialisation that arise in an industry when it is characterised by high economies of scale. The presence of such economies of scale in production would lead to the existence of only a limited number of global players in the market. Those firms that are first-movers may benefit from their early entry and establish themselves, erecting entry barriers for others. It has been argued that to be successful in such an environment, in addition to the firm being lucky, entrepreneurial, and innovative, the nation itself must have a strategic, pro-active trade policy that facilitates first-mover advantage in key and newly emerging industries (Hill, 2000). Porter’s national competitive advantage theory postulates the existence of a diamond that consists of factor endowments, demand conditions, related and supporting industries, and firm strategy, structure and rivalry. The diamond will be favourable when the four components are in place along with an element of luck and favourable government policies as was the case for the Japanese automobile industry in the 1980s (Porter, 1990).
In practice, the different theories of international trade obviously complement each other and make their own contributions. They apply as much to trade in goods as to trade in services – including maritime transport services: Flag registries, for example, surely benefit from economies of scale, shipyards require an endowment of capital and labour, and London was a “first mover” concerning insurance and finance. Later on, we will look in more detail at this specialisation in different maritime sectors.
And what does trade mean for economic growth and well-being? Under almost any model, it is “potentially possible to find a free trade consumption point and an appropriate lump-sum compensation scheme such that everyone is at least as well-off with trade as they had been in autarky” (Suranovic, 2002). And, accordingly, “international economic integration yields large potential welfare effects” (Anderson and Wincoop, 2001). The posterior distribution of these benefits within society is a different matter, beyond the scope of this chapter.
2.2.2 Mainstream economics and its consideration of transport
How does transport fit into this analysis of trade and economic development? Standard Economics text books, if they include it at all, do so by considering it as part of the overall transaction or arbitrage costs. Trade will take place if price differences between two countries are higher than the total transaction costs.
Until the early 1970s, transport and transport-related infrastructure played an important role in location theories and development economics, including the lending policies of the World Bank and bilateral technical cooperation. It was assumed that by simply providing for infrastructure such as ports, roads and bridges, developing countries would soon become more competitive and catch up with the industrialised nations. This changed for two main reasons: first, as transport costs declined and connectivity and efficiency improved, it was assumed that further improvements in transport were no longer relevant for trade and development. Secondly, the relationship between transport and economic growth is quite complex, and impacts of changes were – and still are – difficult to measure. Some of the measurable results of infrastructure investments were actually disappointing or even contrary to the expected and desired impact. For example, if imports suddenly became more competitive, port investments actually led to a closure of local industries (Pedersen, 2001; Hilling, 1996; Simon, 1996).
(Only) once a Nobel Memorial Prize in Economics has so far been given to authors who worked – partly – on transport-related topics; that was in 1993, when the prize was won by Robert Fogel and Douglass North. Fogel’s main contributions included research on the role of the railways for the development of the national economy in the United States. Douglass North worked, inter alia, on the economic development in Europe and the United States before and in connection with the industrial revolution, including the roles of sea transport and changes in the pattern of regional specialisation and interregional trade.
Nowadays, most trade models include transport costs or some related variables, such as distance and common borders, to explain the geographical distribution of international trade flows. In empirical research, measurable reductions in transport costs are taken as a given exogenous trend, driven by technological advances, that obviously promotes trade. O’Rourke and Williamson (1999), for example, analyse how in different historical periods trade grew as a result of reductions in freight rates.
Yet still, “there isn’t nearly as much trade as standard trade models suggest that there should be. Formal trade barriers such as tariffs and quotas are far too low to account for much of the missing trade while changes in tariffs and quotas in the last 50 years explain too little of the growth in trade. Transport costs help explain the missing trade, but distance and other location variables are far too important in their trade suppressing effects to be accounted for by the effect of distance and measurable transport costs. Fall in measured transport costs do not fully explain the growth in trade. These anomalies have until recently been ignored by the profession” (Anderson, 1999).
Whether transport costs have fallen or not is surely debatable, and we shall briefly discuss this question later on. What is true, however, is that by considering only transport costs and not the other aspects (such as connectivity, safety, security, reliability, speed, or port facilitation), many trade analysts have not been too impressed with the advances in the field of transport and their impact on trade growth. And what has long been ignored altogether is how increased trade influences transport costs.
2.3 Trade and its transport: A mutual relationship
2.3.1 Rediscovering transport as a determinant of trade
Any answer to the question of “why do nations trade (so little)” (Anderson, 1999) needs to look at transport costs and shipping connectivity. Since the late 1990s, in the context of globalisation and the analysis of its causes and impacts, transport has moved back to the mainstream of economics and related sciences. Thompson (2000), from the World Bank, writes he is “delighted to see the general economics profession rediscovering the importance of transportation costs and geography in international trade considerations”, and Pedersen (2001) explains that “during the 1990s transport and communication appear slowly to be on their way into the mainstream again, but now transformed into a much broader concept of logistics, which has become an increasingly important element in the organisation and restructuring of the globalising economy. From being an external factor, transport has become an integrated part of the production and distribution system”.
Initial empirical research which incorporates transport into trade and economic policy analysis includes Limao and Venables (1999), who conclude that “halving transport costs increases the volume of trade by a factor of five”. In a related paper (Venables and Limao, 1999), the same authors highlight that a “theory of trade that ignores transport costs will yield systematically incorrect predictions about trade patterns, industrial structure, and factor incomes”.
To redeem such shortcomings, several authors have in recent years incorporated measures of transport costs into trade models. An overview is provided by Korinek and Sourdin (2009), who specifically analyse maritime transport costs as determinants of international trade and conclude that a 10% increase in maritime transport costs is associated with a 6 to 8% decrease in trade, other things being equal. Wilmsmeier and Sanchez (2009) look specifically at food prices and conclude that any debate on food policy “requires a good understanding of the functioning of transport markets and their role in food transport chains”, while Disdier and Head (2008) find a “puzzling persistence of the distance effect on bilateral trade”.
Several international organisations are now paying increased attention to this issue, IADB (2009), for example, concludes that “transport costs have assumed an unprecedented strategic importance” for Latin America and the Caribbean. OECD (2008) sets out an ambitious research agenda (a) to examine the impact of transport costs on trade; and (b) to examine the impact of different components of transport. World Bank (2009) analyses transport costs in Africa because “(it) is well known that weak infrastructure can account for low trade performance”. UNCTAD (2004) concludes that “Improved transport services for developing countries are key determinants of the new international trade geography, including South–South trade and increased merchandise exports of developing countries. However, not all developing countries are so far benefiting from this new trade geography and further efforts are required to improve transport services and infrastructure especially for least developed and also landlocked countries. The challenge for policy makers is to initiate a virtuous cycle where better transport services lead to more trade, and more trade in turn helps to encourage improved transport services.”
2.3.2 What are the determinants of maritime transport costs?
Limao and Venables (1999) and also Radelet and Sachs (1998) not only use transport cost data to explain trade, but also undertake regressions to explain transport costs. The explanatory variables used in their analysis are basically related to distance and connectivity, such as if countries are land locked, or if trading partners are neighbours, and to country characteristics such as GDP per capita. García Menéndez et al. (2002) investigate the determinants of maritime transport costs and the role they play in allocating trade across countries for the case of the ceramic sector (tiles). They include a discussion on the sensitivity of trade flows and transportation costs to the existence of back hauling, and suggest that higher distance and poor partner infrastructure increases transport costs notably. Inclusion of infrastructure measures improves the fit of the regression, corroborating the importance of infrastructure in determining transport costs. Higher transport costs significantly deter trade, and distance does not appear to be a good proxy for transport costs, at least not in the ceramic sector. For Latin America, continuing work by Micco and Pérez (2001), Sanchez et al. (2002) analyse the impact of port reform on transport costs, and also possible determinants of the port reforms themselves. Hummels (1999a, 1999b, and 2000) discusses if “international transport costs have declined”, and he introduces “time as a trade barrier”. One of his conclusions is that that “each day saved in shipping time is worth 0.5 percent ad valorem, approximately 30 times greater than costs associated with pure inventory holding” (Hummels, 2000). Fink et al. (2001) analyse how liberalisation in trade in transport services leads to further reductions in transport costs, which in turn lead to a further promotion of trade in goods. Although criticised in its methodology and specific conclusions concerning liner shipping’s anti-trust immunity (World Shipping Council, 2001), there is no doubt that the liberalisation and globalisation of the maritime business (see section 3 of this chapter), have led to a reduction of transport costs, which is contributing to the globalisation of trade and global production.
What was still missing in the earlier literature was a more thorough consideration of the mutual relationship between trade volumes, transport costs, and the quality of transport services. For example, higher quality of service implies higher transport costs, yet also promotes trade. Economies of scale from high trade volumes have a strong negative (i.e. decreasing) impact on transport costs. Therefore, it appears that the strong relation between trade and transport costs detected by Limao and Venables (1999) quoted above does not only reflect the elasticity of trade towards transport costs, but also almost certainly reflects the economies of scale through which higher volumes lead to lower costs of transport.
Research on the determinants of maritime transport costs has advanced significantly during the current decade. The basic findings of the regressions we first presented in the earlier version of this chapter (Kumar and Hoffmann, 2002) are confirmed by numerous subsequent studies. Based on results from Sanchez et al. (2003), Wilmsmeier et al. (2006), and Wilmsmeier and Hoffmann (2008) as well as the literature review provided by OECD (2008), six key determinants of freight costs, i.e. the price charged to the shipper, for maritime transport can be summarised as follows.
- Distance: Surely distance plays some role as a longer journey requires more fuel and other operating expenses. This impact is stronger for bulk shipping than for containerised liner shipping. For the latter it is found that doubling the distance increases freight rates by only 15 to 25%, and distance on its own will usually statistically explain just one fifth of the variance of container freight rates.
- Economies of scale: Larger trade volumes and bigger individual shipments reduce unit transport costs. The largest 13,000 TEU container ships cost half as much to build per TEU than vessels of 2,500 TEU, and employ the same number of crew. Larger trade volumes and shipments are also correlated with other determinants of transport costs, such as port infrastructure and competition between services providers.
- Trade balances: On many trade routes, volumes moving in one direction are higher than those moving in the opposite direction. As carriers then have empty ships and containers available for the return trip, freight rates for the return trip may be just half of the rate of the outbound trip. Even if individual countries have a more or less balanced trade (e.g. Chile and Korea), the freight rate from Korea to Chile may still be far higher than the rate from Chile to Korea, because the overall trade balance on the route is determined by the Chinese surplus with the United States.
- Type and value of traded goods: Obviously transport costs vary depending on the type of commodity traded, i.e. dry bulk, oil, containerised cargo, or break bulk. If insurance costs are included in the overall transport costs a higher value per tonne of the commodity will also increase freight charges. Interestingly, it is found that for containerised trade, even if insurance costs are excluded, freight charges per TEU are still higher for higher value goods than for less costly commodities. Carriers used to say that the freight rate is “what the market can bear” – and the market for transporting toys can bear a higher freight rate per TEU than the market for waste paper. Put differently: The demand for transporting low-value waste paper has a higher price elasticity and, hence, waste paper will only be put into a container if freight rates are low.
- Competition and transport connectivity: Competition among carriers and competition between different transport modes reduces transport costs, i.e. the freight rates charged to the shipper. If countries are neighbours and can trade by road, rail or pipeline, freight rates for sea-borne trade are lower. If countries are not connected to each other through direct liner shipping services, but instead containerised trade between them requires as least one transhipment port, freight rates also tend to be higher. Interestingly, it is found that once there are more than four carriers providing direct services, freight rates decrease even further – a possible interpretation is that if there are only up to four providers we are confronted with an oligopoly.
- Port characteristics and trade facilitation: Better port infrastructure, private sector investment, perceived port efficiency and shorter waiting times at Customs have all been found to lead to lower freight rates. Although better infrastructure may actually lead to higher port costs charged to the carrier, the latter will still reduce his freight rate charged to the importer or exporter, because the gained time and reliability more than offsets the possible payments to the port. As regards trade facilitation as measured for example by shorter Customs clearance times, these tend to be correlated with lower maritime freight rates for imports. The efficiency of a port is closely correlated with a country’s per capita GDP and it is found that richer countries also tend to benefit from lower freight rates for their exports. A country’s “maritime nexus” to globalised trade through its seaports is thus two-fold: better ports help countries to connect and develop – and at the same time more developed countries are better positioned to invest and reform their ports.
2.3.3 A note on transport and regional integration
If it is true that international transport (unit-) costs are declining, and distance has a decreasing impact on these transport costs, why then apparently regional trade is growing (even) faster than inter-regional trade? Intra-Asian container traffic is growing faster than global container traffic. Intra-European or intra-MERCOSUR trade has been increasing at a higher rate than trade between these two regional blocks.
Some of the intra-regional trade growth certainly has less to do with transport but rather with language barriers, historical trends, trade facilitation at common borders, and lower intra-regional tariffs.