Evaluating the Current State of Your Ecosystem
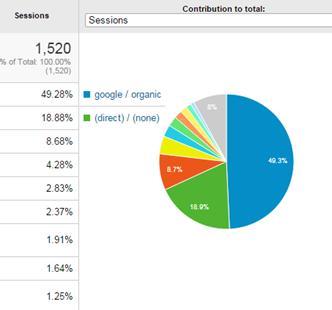
Figure 10. The Analytics dashboard.
What is this data telling us about how people are responding to your website?
The first piece of information to look at is your website’s “Bounce Rate.” A “bounce” is when someone visits your website and leaves the website without viewing a second page. That is to say, the visitor bounces out. “Bounce Rate” is the percentage of people who bounce out of your website as compared to all visitors.
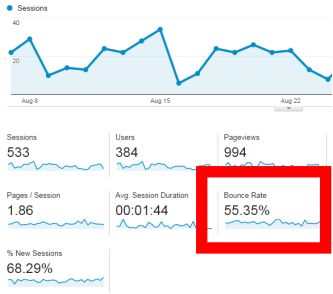
Figure 11. A website’s “Bounce Rate.”
Your website’s bounce rate is important because it tells us how inviting people are finding your content. If your bounce rate is 80%, for example, then that is a clear indication that there are problems with your website. If your bounce rate is around 50%, then it suggests that people are being drawn into your website in good numbers. The lower your bounce rate, the better the website.
Google has said that it views a 75% bounce rate as acceptable, but I believe that is much too high. The 55.35% bounce rate for the website in Figure 11, above, is reasonable but not great.
Other important metrics are pages per session and average session duration because they tell us how much of your content people are looking at and how much time they spend reading it. The more pages they view and the more time they spend on your website, the better. Figure 12, below, shows where to find the information relating to pages per session (meaning how many pages your visitors viewed on average) and average session duration (meaning how much time on average people stayed on your website).
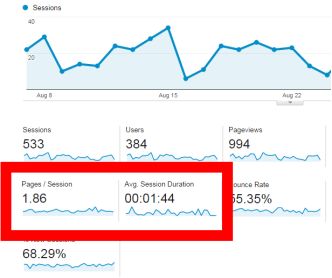
Figure 12. A website’s pages per session and average session duration.
As with the bounce rate in Figure 11, above, this website’s numbers in these two areas are good, not great. If your pages per session are 1.2 and your average session duration is 45 seconds, that is an indication that people are not finding your content very interesting.
Traffic sources for your “Thank You” page
If you have a page after your contact form that says something to the effect of “Thanks for your inquiry. We’ll get back to you soon,” then we can look at the traffic to that page to determine how often people use your contact form, which speaks to the effectiveness of your website in getting people to use the contact form.
The traffic source data to that page will also tell us which referral source results in the most inquiries.
You may not have a “Thank You” page or even a contact form for that matter, in which case this isn’t going to work. If you are not sure whether you have a standalone “Thank You” page, simply send yourself a test submission through the form and check the name of the page in the address bar at the top of your browser. If the address of the page changes in your browser, then you probably have a standalone “Thank You” page, and all is good. If the address doesn’t change, but instead is the same address as the contact form page, then the “thank you” message is dynamically generated and this Analytics data will not be obtainable.
Figure 13 below, is an example of what the data would look like.
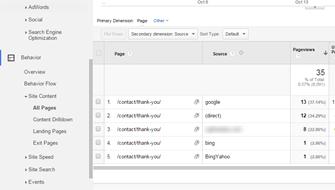
Figure 13. Traffic sources to “Thank You” page.