Energy Economics and Trade
Chapter 5
Energy Economics and Trade
Michael Tamvakis*
1. Introduction
It is a well known fact that the international maritime industry is driven by the movement of goods and people. Maritime economists have long established that the demand for shipping services is derived from the demand for international trade and awareness of what drives the latter is the aim of this chapter.
Within the space and scope of the next few pages, it is impossible to cover all trades and factors that affect demand for maritime services. We will focus, instead, on the economics and major trade patterns of the most important commodity group, energy, which encompasses three very important commodities: crude oil and products, gas and coal.
2. Energy
2.1 Demand for energy
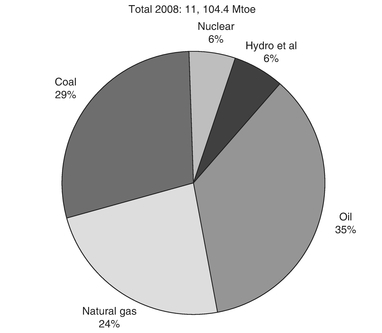
Energy is what drives modern economic development and for the last couple of centuries at least, human societies have relied on hydrocarbons for the supply of that energy. Despite continuous research and initiatives into the development of renewable, sustainable and ecologically friendly energy resources, we very much rely on three major forms of hydrocarbons – oil, coal and gas – for effectively 90% of the world’s primary energy consumption (see Figure 1).
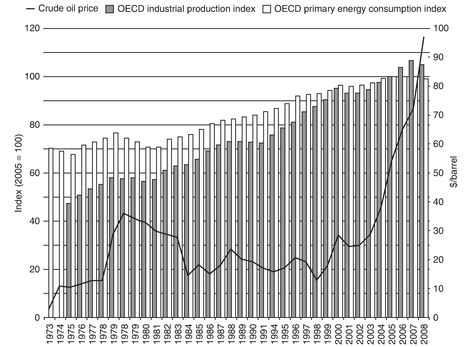
With the widespread use of hydrocarbons in all aspects of economic activity, consumption of energy commodities has been closely linked with a nation’s development and its transition from a traditional, agriculture-based economy, to a developed, industrialised one. A recent poignant example is that of China, which from the 1990s onwards has transformed itself into the world’s industrial powerhouse. On an aggregate basis, it is reasonable to assume that energy consumption is directly related to the level of gross domestic product (GDP). Figure 2 shows a proxy of this relationship by
Source: BP Statistical Review of World Energy, 2009
looking at the development of industrial production and primary energy consumption in OECD countries since 1973. Notice the fundamental change in the relationship between the two indices after 1980. For comparison, the price of oil is also plotted on the same chart, and highlights the effect it has had on energy consumption.
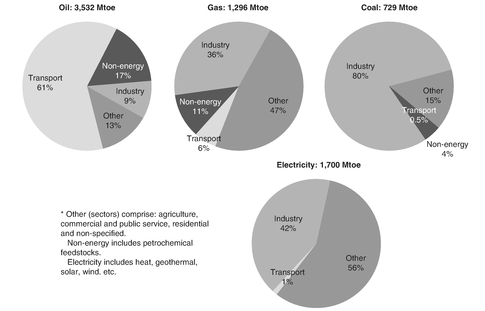
The notion of a straightforward relationship between energy consumption and GDP is quite appealing, but rather simplistic. One has to look at the disaggregated picture of energy consumption to get a more accurate idea of the underlying demand parameters. Primary energy consumption is usually classified into four broad categories: industrial; transport; other (incl. residential and agriculture); and a fourth residual category encompassing all non-energy uses. Figure 3 shows the OECD estimate of energy usage in the world, by fuel, in 2007.
2.1.1 Residential consumption
Like for any other good, demand for energy depends on the price of the commodity and the total disposable income of households. Any change in the price of the commodity will affect the quantity purchased by consumers. For example, if the price of oil falls, its consumption is expected to increase ceteris paribus. The total change in consumption is usually split between the income and the substitution effects. The first is attributed to the fact that with the new, lower price the same amount of income will buy more units of the commodity; the second effect is due to the switch from other, more expensive substitutes to the lower-priced commodity.
Source: OECD Key Economic Indicators, BP Statistical Review of World Energy; Datastream
When analysing the demand for specific energy commodities, it is always useful to know their responsiveness to changes in their own price, changes in disposable income and changes in the price of substitutes. This responsiveness is measured by the own price – or demand – elasticity, the income elasticity, and the cross-price elasticity. The usefulness of these three parameters was eminently demonstrated during the two oil price shocks in 1973 and 1979. While the first shock put pressure on household incomes, which had to accommodate a larger expenditure for energy, it did not tamper demand for oil substantially. This was not the case with the second oil price shock, however, when income and price elasticities of oil experienced a structural change and led to a dramatically reduced demand for oil. In yet another demonstration of the change in these fundamental relationships, demand for energy in recent years seems to grow unabated despite the persistent ascent of oil prices.
2.1.2 Industrial consumption
The production cost of an industrial process depends – in the short to medium term – on the cost of its inputs and a set of fixed costs; in the long term, of course, all costs are variable. The production cost function can be formally written as C = ƒ(X1… Xn, E, FC), where X1…Xn are production inputs, E is energy and FC is fixed cost. This function
Source: IEA Key World Energy Statistics, 2009
represents a slight deviation from the usual norm of depicting production costs as a function of capital and labour, and is more suitable for our purposes.
The total demand for industrial energy can be viewed as an aggregation of all production cost functions like the one given above. The effects of price changes on energy demand will depend on the rate of technical substitution, which represents the rate at which one input of production can be replaced by another, in order to achieve the same cost.
In practical terms the rate of technical substitution shows how easily energy can be replaced by other input factors, and how easily different sources of energy can substitute one another in the same production process. Once again, a suitable example can be taken from the two oil price crises. The first price shock took industry by surprise, as no cost-effective alternatives to oil were available. The second shock, however, came after considerable restructuring in energy usage and efficiency had been implemented, with the result that total energy requirements were reduced and alternative sources of energy – predominantly coal, but also natural gas and nuclear power – replaced oil.
2.1.3 Transport consumption
Energy consumption in transport is dominated by oil, which displaced coal earlier or later in the history of different transport means. In the car industry, for example, gasoline was used since the very beginning, as it was the most appropriate fuel for the internal combustion engine. At sea, coal was dominant until after the end of the World War I, but was rapidly replaced by oil afterwards. On land, coal persisted slightly more
Source: Energy Information Administration, US Department of Energy, 2006
as a source of energy for locomotives, but eventually had to give in to oil’s undisputed superiority.
Today, oil is used in transport almost exclusively; perhaps the only notable exception is that of Brazil, which has promoted the extensive use of sugar-derived biofuel in the 1970s and, again, in current times. Setting aside the past and possible future use of biofuels, very few other oil substitutes have been used in transport; notably natural gas and liquid petroleum gas (propane).
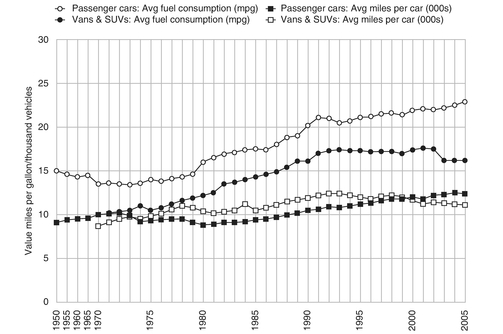
Because oil has virtually no – commercially viable – substitutes in transport, demand for it depends very much on income and efficiency of use. The latter is probably more important, as is shown in Figure 4, which graphs the development of car efficiency in the United States. Two indicators are used: the rate of fuel consumption expressed in miles per gallon; and the car usage expressed in average miles per car. Two types of vehicle are also shown: passenger cars and vans and SUVs (sports utility vehicles). As one can see, mileage was not affected substantially, despite the oil price hikes in 1973 and 1979. The rapid increase in car fuel efficiency, assisted by the mass introduction of Japanese cars in the American market, helped sustain the great love affair of US consumers with the automotive industry and provide endless material for ‘road movies’ to Hollywood scriptwriters.
Transportation is not of course limited to road only. The other two major consumers are air and seaborne transportation. The former has risen to prominence, due to the general increase in passenger and cargo air-miles travelled and due to the fact that the fuel used (aviation turbine fuel or jet kerosene) is one of the most valuable refined petroleum products. However, the importance of shipping fuel consumption (in the form of either heavy fuel oil of marine diesel) cannot be underestimated, given that an estimated 75% of the world merchandise trade is seaborne.
2.1.4 Other consumption
This category encompasses all the remaining sectors of the economy, primarily energy consumption for agricultural use and commercial buildings. Parameters affecting this segment of consumption include fuel efficiency and the degree of mechanisation of agriculture.
2.2 Supply of energy
Energy can be generated by both exhaustible and renewable resources. The latter have amassed considerable scientific attention and certainly have ample potential, but their share of primary energy consumption remains very modest and is dwarfed by the dominant position of exhaustible hydrocarbons. In this chapter we will focus only on these very hydrocarbons: oil, gas and coal.
Like other minerals, energy commodities fall in the category of exhaustible resources. Available reserves, rates of extraction and economic rents are some of the parameters governing the usage of exhaustible resources. The theory behind this was explored as early as 1929 by Hotelling who built a basic economic framework for the exploitation of non-renewable natural resources.
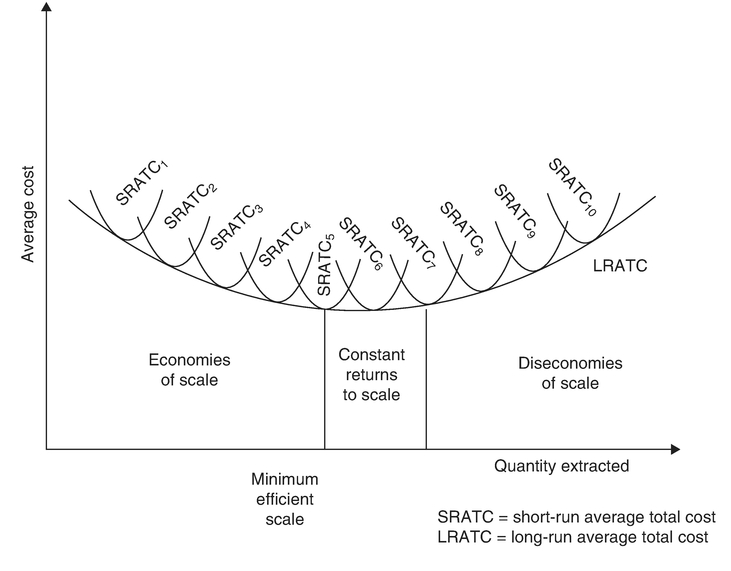
Basic economic theory anticipates that each additional unit (the “marginal” unit) of a natural resource will be extracted as long as the economic cost of extraction – which includes marginal1 cost and user2 cost – is lower or equal to the price3 paid for the resource plus the marginal utility of present consumption.4 Like in most production processes, extractive firms benefit initially from increasing returns to scale, then their average total cost curve stays flat for some time after reaching the minimum efficient scale, and if they decide to increase output further they are usually faced with decreasing returns to scale. In the long-run, production tends to stabilise along the bottom of their long-run average total cost curve (see Figure 5).
The theory, as it stands, implies that high-cost producers – which usually also have limited reserves – should be the first to be squeezed out of the market when energy prices fall and operating costs are not covered. It also implies that large low-cost producers should be relatively immune to price downswings, and continue to produce under all – but the most extreme – market conditions.
Alas, real life is not as clear-cut as this model suggests. To take yet another example from the oil industry; although Arab OPEC countries are indisputably the lowest-cost producers, it is high-cost producers that seem to be operating at full capacity, while low-cost competitors seem to play the role of “swing’ producer”5 balancing demand and supply.
The picture becomes even more complicated when government economic policies are taken into account. Energy supplies are of strategic importance to every government worldwide. If they are in abundance, they will be used to cover domestic needs and the balance will probably be exported; if they are in short supply, the government will resort to imports and a certain amount of stockpiling for security reasons.
If security of supplies is a major issue on the energy agenda, demand will tend to be biased towards certain (perhaps low-cost) producers, and “secure” (perhaps high-cost) suppliers will realise this and step up their production. Finally, if financial flows from exports and/or export taxes are considered as well, national fiscal and monetary policies may distort the picture even further.
In any project for the extraction of mineral resources there are three main stages: exploration, development, and production. Exploration may last a few years, until proper geological surveys point with high probability to the existence of reserves. Several exploratory wells/shafts may have to be drilled in order to assess the quality and extent of the deposits. Costs at this stage can be substantial and are sunk. The development stage involves extensive drilling in the case of oil and gas, and construction of an open pit or underground mine in the case of coal. Again, costs at this stage are sunk, and further costs might have to be incurred at later stages of a project, in order to improve and/or extend capacity.
At the production stage, most of the costs are operating costs, which tend to increase as reserves are being depleted and more effort is required to extract them. This is particularly true for coal, especially when underground mining is the method of production.
Energy projects use capital quite intensively and embody a substantial amount of risk. Even when adequate reserves are found, the high rate of discount applied to such projects makes the extraction of the commodity more desirable sooner rather than later. This argument is often used to explain the intensive exploitation of high-cost oil
reserves like the ones in Alaska or the North Sea, in order to maximise oil recovery as quickly as possible.
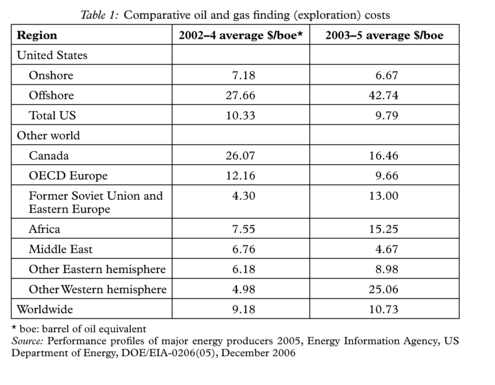
Another important characteristic of the energy sector – and the mineral sector in general – is the large extent of heterogeneity in production costs. Depending on the geomorphy of the field and local climatic conditions costs can vary considerably from one region to the next. In the oil sector, for instance, capital expenditure for field development may range from “low-cost” to “frontier areas”, as it is shown in Table 1.
A similar situation is evident in the coal industry, with Venezuela, Indonesia and South Africa in the low to medium-cost producers, while countries like USA, Germany, UK and France are at the other end.
3. Oil
With a share of 35% in world primary energy consumption, oil remains the leading energy commodity, and has been so for at least the past four decades. Oil reserves currently amount to just over one and a quarter trillion barrels, over half of which are located in the Middle East. Latin America is the second largest reserve holder, with deposits mainly in Mexico, Venezuela and, more recently, Brazil. The other dominant reserve holder is the former Soviet Union, particularly Russia and Kazakhstan.
What is remarkable about the oil sector is its imbalance in terms of reserves. It has to be noted, however, that production by different countries has never been proportional to their reserves, as technology, investment capital, and finance are not freely available to all producers, and political conditions have often distorted economic principles of production.
3.1 Geology and extraction
Oil is one of a number of hydrocarbon compounds that can be found in the earth’s crust. In fact four-fifths of the world’s sedimentary basins provide suitable geological conditions for the formation of crude oil. On several occasions, parts of the earth’s crust move against each other to form an anticline, which creates a reservoir of impervious rock, where organic material is trapped and broken down by enzymes over a period of several million years. A reservoir usually contains several oil fields, some of them grouped together in provinces. The organic material contained in the fields is a mixture of oil, water and gas. Oil floats on top of the water, while gas provides pressure in the field, which is invaluable for the extraction of the precious fuel.
Oil exploration is the part of the oil industry that has always caught the imagination of the masses, as it contained a huge element of risk, but offering the possibility of extremely good returns. Modern oil exploration does not rely that much on luck any more. A number of scientific methods are used for the location of possible oil reservoirs and the estimation of their reserves. These are usually grouped in three main categories: geophysical analyses; geophysical surveys; and drilling and well logging.
Geological analysis includes a number of alternative – and often complementary – methods, ranging from traditional field geology (examining surface rocks), to the use of orbiting satellites. Geochemical analysis is also used, in order to establish the presence of suitable material for the formation of oil deposits. The aim of all the above techniques, is to understand the geological structure and history of an area, and decide whether it is worthwhile to spend more money on exploring it.
The main geophysical technique used nowadays is the seismic survey, although gravimetric and magnetic surveys can also be used to identify underlying structures that are possibly oil-bearing. Seismic surveys involve the artificial generation of shock waves, using a variety of techniques, like controlled explosions, dropping of weights and vibration generators (see Figure 6). The aim is to record the reflections of those waves by the various geological strata. The data are recorded by geophones, which are similar to seismographs, and then transmitted and recorded.
The recording stage is followed by the processing of the data collected, which involves their enhancement by computers. Finally, the results are interpreted by experts, who build an image of the underground formations and the likely location of deposits. All three stages (recording, processing and interpretation) have been immensely improved by the use of enhanced computer technology. The latter has allowed the advance from 2D to 3D seismic surveys, which use a lot more signal recorders and provide a far more accurate picture of underground formations. A traditional 2D seismic survey, until a few years ago, was shot along individual lines, at varying distances, producing ‘pictures’ of vertical sections of the underground formations. A 3D seismic survey, on the other hand, is shot in a closely spaced grid pattern and gives a complete, more accurate, picture of the subsurface.
The next stage in oil exploration is well drilling. To collect more accurate survey data, boreholes are drilled on top of the area suspected to contain oil reserves. Many of these wildcat drills end up as dry holes. The purpose of the boreholes is not only to extract the

Source: Satellite Imaging Corp., www.satelliteimagingcorp.com
oil. For the purposes of well logging, rock cuttings, core samples and geophysical data are extracted from boreholes, giving scientists an idea of the local geological structure and, if any oil does exist, the history, nature and extent of the reservoir.
The boreholes that are successful eventually become oil wells. Neighbouring wells are normally grouped together to define an oil field. To date, there are over 30,000 known oil wells. Of these, 330 produce just over 50% of the world’s oil output, while just 17 of them produce over 30% of the same. Some of the wells are classified as giants – each holding over 0.5 billion barrels of reserves – while the biggest of wells and/or fields are also known as elephants. The largest of all oil fields, Ghawar, is located in Saudi Arabia, and is estimated to hold approximately 70 billion barrels of oil reserves. To put this in perspective, the Ghawar field accounts for more than a quarter of Saudi reserves (estimated at 260 billion barrels in 2006).
The discovery of oil deposits and the drilling of oil producing wells is not, of course, the end of the story. The entire production process has to be organised properly. This involves a detailed reservoir management plan; the well layout and design; design of production and evacuation facilities; and an implementation schedule covering the drilling of wells and construction and installation of facilities.
The next step is to ensure that oil can be extracted in the most efficient way. The reservoir’s own pressure is usually sufficient, at least initially, to drive the oil or gas to the surface. When recovery levels are low, however, secondary recovery enhancements can be used, whereby the reservoir’s natural drive is supplemented with the injection of water or gas. Finally, where both natural drive and secondary recovery are not producing the desired production levels, enhanced oil recovery (EOR) methods can be used. These techniques are considerably more expensive and must be justified by oil market conditions. EOR methods include: the heating of oil by injecting hot water and/or steam, in order to increase its viscosity and flow; mixture of oil with a suitable gas or liquid solvent to reduce or eliminate residual oil trapped in the displacement process; and use of chemical additives, which modify the properties of the water that displaces the oil and which change the way water and oil flow through the reservoir rock.
Oil is not the only fuel produced by oil wells. Natural gas liquids (NGLs) are byproducts of oil extraction. NGLs include: a type of light oil called natural gasoline; a mixture of petroleum – or ‘wet’ – gases, like butane, propane and ethane; and sometimes natural – or ‘dry’ – gas, which is methane.
There are also “non-conventional” sources of oil. These include: kerogen, which consists of hydrocarbons not yet developed into oil; tar sands, which are impregnated with oil; and synthetic petroleum, which can be produced – rather expensively – from coal. Non-conventional hydrocarbons have remained largely unexploited due to the large costs involved in their processing. However, in recent years (since the early 2000s), the industry has shown renewed interest in developing them, especially tar sands, as their production becomes more economically viable in the light of oil prices fluctuating between $60–70 per barrel.
3.2 Physical characteristics
Oil has three physical characteristics which have significant economic importance. The first one is specific gravity. Crude oils are classified as: light, or paraffinic; medium, or mixed-base; and heavy, or asphaltic. Light crudes have lower specific gravity and are easier to refine. Specific gravity is measured in “degrees API”, which were introduced by the American Petroleum Institute. The lighter the oil, the more degrees API attributed to it. The baseline is the specific gravity of water, which is 10° API. Crudes below 22° API are considered heavy, while those above 40° API are considered light.
The second characteristic is viscosity, which is sometimes measured in centistokes. The more centistokes, the more viscous (thick) the crude, and the harder it is to burn. Two common grades of crude oil, typically used for vessel bunkers, have viscosities of 180 CST (intermediate fuel oil – IFO) and 380 CST (heavy fuel oil – HFO). One more detail: the centistoke value of a crude oil changes with temperature. Hence, a typical assay will contain viscosity measurements at several different temperatures.
Finally, a crude’s quality also depends on its content in sulphur. Crudes with high sulphur content are known as “sour” crudes, while the rest are known as “sweet”.
3.3 Reserves
As with any non-renewable natural resource, it is important to be able to establish the stock of reserves available for future extraction. The total reserves worldwide are known as ultimate reserves, but their estimation is of little practical use. It is more interesting to estimate the amount of oil-in-place, which is an indication of recoverable reserves. Reserves, for which there is conservatively reasonable certainty of production under existing economic and operational conditions, are called proved reserves (see Figure 7).
Source: BP Statistical Review of World Energy, 2009
In contrast, probable reserves are those whose production would be achievable as a result of further exploration and development, or changed economic and operating conditions.
Frequently, the reserves:production ratio is used as an indicator of the future life of existing reserves. The ratio shows the number of years that reserves will last, if production (see Figure 8) continues at the current rate. The R:P ratio, however, only offers a view of the future, extrapolated from the present, and assuming that technology and prices remain unchanged.
3.4 Trade in crude oil
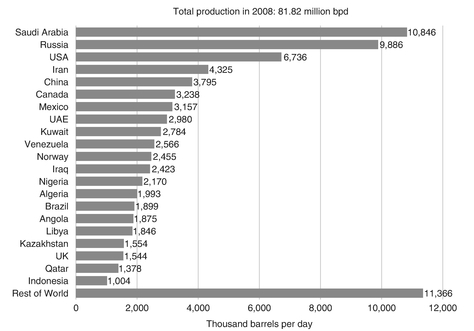
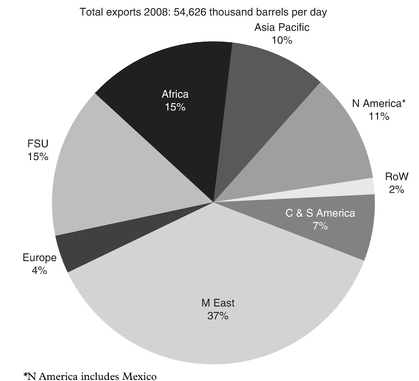
From a total of approx. 3,900 million tons (or nearly 82 million bpd) of oil produced in 2008, some 2,700 million tons (54.6 million bpd) were traded internationally. Of these, over 75% was carried by sea. Throughout oil’s turbulent history, international trade has played an important role. In fact, one of the biggest integrated oil companies – Royal Dutch Shell – started life as a trade and transport company.
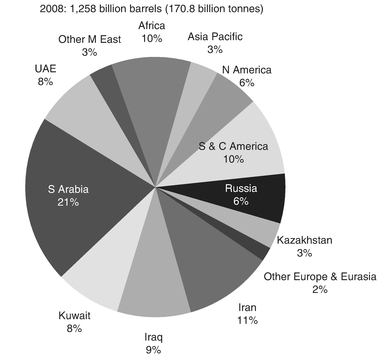
Despite the political uncertainty associated with the region, the Middle East remains the world’s top oil exporter, supplying approximately 37% (in 2008) of the world’s crude oil exports (see Figure 9). The vast majority of flows are directed towards three man areas: North America, Northwest Europe and Asia Pacific. These flows coincide
Source: BP Statistical Review of World Energy, 2009
very much with the main trade routes for VLCCs and some of the larger-size tanker tonnage. Following Middle East, Africa and FSU come a distant equal second. Western (mainly Nigeria and more recently Angola) and North (mainly Libya and Algeria) Africa are very important suppliers to the European Union and Nigerian crude is also very comp etitive in transatlantic trades to the USA.
FSU exports are dominated by Russia, the world’s second largest exporter after Saudi Arabia, and Kazakhstan. The importance of Russian exports to the European Union cannot be overestimated and the supply routes start from West Siberia through the Baltic Sea (Primorsk), and from the Caspian Sea through the Black Sea (Novorossiysk). Smaller suppliers, like Azerbaijan, generate less exports, but they strive to disengage from their dependence on the Russia oil pipeline system and gain direct access to the export markets through alternative routes.
Latin America (mainly Venezuela and Mexico) are the most important short-haul supplier to the USA (after Canada which largely exports to the USA via pipelines) and are the first recourse for short term demand upsurges (e.g. due to cold weather). The rest of the demand generated by the world’s largest consumer of oil is satisfied either by medium-haul (West Africa and North Sea), long-haul (Arabian Gulf) or domestic (Alaska) supplies. Pacific Rim countries are still largely dependent on the Middle East for their imports, although some of their demand is satisfied by regionally produced crudes in Indonesia, Australia and Vietnam.
Source: BP Statistical Review of World Energy, 2009
4. Oil Products
Much of the discussion up to now has dealt primarily with crude oil, although trade figures referred to both crude and products. In this section, I will begin with a brief description of the refining process, continue with the main categories of refined products and, finally, discuss production, consumption and trade patterns for major regions, like the United States, Western Europe and South East Asia.
4.1 Refining process
Although much of the economics of the oil industry revolves around crude oil, it is the final products that are used by the end-consumers. Crude oil is rarely usable and has to be refined and broken down into products adequate for final consumption.
The fundamental principle on which oil refining is based has not changed since the nineteenth century: crude oil is heated until it is vaporised and then the vapours are condensed separately, according to the boiling points of their constituent molecules; the procedure is called distillation. Crude oil is stored into large tanks and from there it is pumped continuously through a series of steel tubes into a furnace. From there it is pumped to the bottom of a tall cylindrical tower, usually 8–24 feet in diameter and 100–150 feet in height. This is called a “fractioning” tower, as it is divided into “floors”, with perforated trays, which allow vapours to pass from lower to higher floors. The hydrocarbon vapours with highest boiling points condense first, on the bottom floors, and those with the lowest boiling points condense last, higher up the tower. The most volatile product – petrol – comes off at the top of the tower and is then condensed separately.
This simple distillation procedure yields about 20% light distillates from an average crude, and usually falls short of the commercial needs for petrol. At the same time, the process yields heavier products in quantities that exceed consumption requirements. To redress this imbalance, some of the heavier oil distillates are further processed, using methods such as thermal cracking and catalytic cracking. Both these procedures allow enhanced recovery yields of petrol from crude: the first procedure used high temperature and pressure to “crack” the large hydrocarbon molecules of heavier products into smaller molecules of petrol and petroleum gas; the second process uses catalysts to facilitate cracking under milder and more easily controlled conditions. Reverse procedures are also available, which reform lighter gas molecules into heavier products, such as petrol. Finally, several of the gases are used as feedstocks for the petrochemicals industry.
The outputs of the refining process are classified into three broad categories: light, middle, and heavy distillates. Light distillates – also known as white or top–end cuts – include ethane, propane, butane, naphtha (all used as feedstock for petrochemicals), aviation turbine fuel (ATF), kerosene, petrol and other industrial spirits.
Middle distillate (or middle cuts) include gas oil, diesel, marine diesel, and medium and high grade fuels. Finally, heavy distillates – also known as black or bottom–end cuts – include heavy fuels, paraffins, lubricating waxes and greases.
4.1.1 Refining: capacities and throughputs
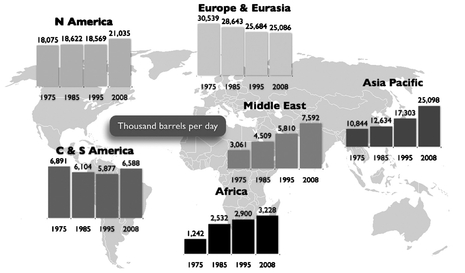
The supply of oil products is very much dependent on the available refining capacity around the world. In fact, refining capacity sets the upper limit to the supply of distillates. What is more interesting in terms of production, however, is the refinery throughput, i.e. the quantity of oil being processed by refineries per annum. This also allows the calculation of refinery utilisation rates, a figure most important for the profitability of a refiner. Figure 10 shows the development of refining capacity through the mid-1970s, 1980s and 1990s and in the late 2000s. Taking a closer look, one can see that North America – and this is mainly the United States – was head and shoulders above the other two important refining regions: Western Europe (which excludes Russia, labelled ‘Eurasia’ in Figure 10), and Asia Pacific. However, Asia Pacific caught up fast and is now on par with the whole of Europe and Eurasia and above North America. These three regions are top in the league of refinery throughputs as well. In 2008, United States alone produced almost 14.6 Mbpd of oil products, with Europe and Eurasia (i.e. Russia) standing at 20.6 Mbpd, and Asia Pacific at 21.5 Mbpd. Within the latter region, the largest refiner used to be Japan (3.9 Mbpd in 2008), but has now been overtaken by China (6.8 Mbpd in 2008), with Singapore accounting for most of the remaining throughput in the region as it is a huge transhipment and refining centre.
Refinery throughputs and consumption of oil products give a broad framework for the study of patterns in international trade in oil products. As we are going to see later, however, trade flows are much more complicated, and there is often exchange of similar
Source: BP Statistical Review of World Energy, 2009
products between countries which produce all distillates, but in varying proportions. This is, in fact, a classic case of intra-industry trade. It is, therefore, essential to look at the composition of the typical barrel of oil – known as crude oil yields – when studying trade patterns.
Oil yields depend on the distillation technology available to the refinery, the grade and quality of the input crude, and also seasonal and consumption parameters of the region in question.
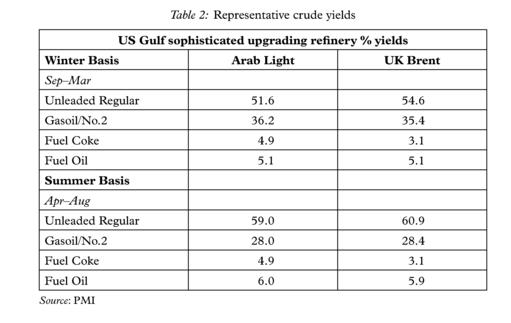
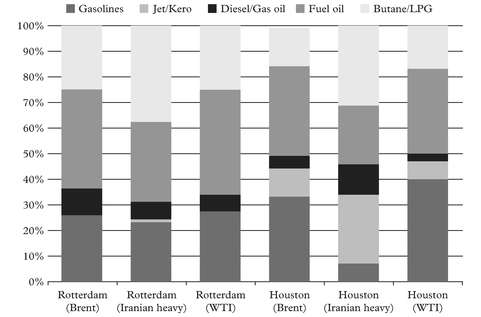
Table 2 lists representative crude yields in a sophisticated and a typical refinery in the US Gulf, during the winter and summer periods. Notice how, in both cases, yields for unleaded gasoline increase during the summer, the season when most Americans travel around the country by car. Figure 11 shows the products yielded by three representative types of crude in refineries in the US Gulf and Northwest Europe.
4.2 Consumption patterns
It is consumption patterns, of course, that influence both the short and the long-term balance of the market. Different regions have different tastes for oil products, depending on their economic activities, climatic conditions and other consumption habits. Although refinery yields can change to match demand, imbalances do arise, and trade flows are generated in order to cover them.
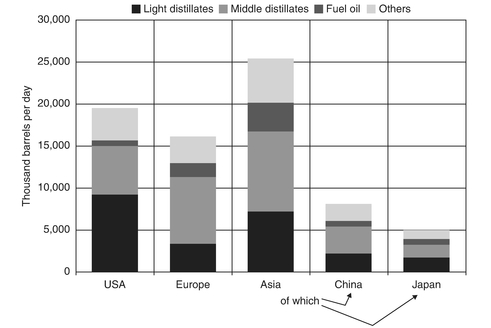
Figure 12 shows consumption patterns in 2008. The United States is a heavy consumer, with the emphasis on gasolines. Western Europe is the second largest consumption area, with the emphasis on middle distillates, while Japan shows a slightly more balanced picture.
Source: Platts
Source: BP Statistical Review of World Energy, 2009
4.3 Trade in products
Trade in oil products is older than trade in crude, but with increasing scale economies in the transportation of crude oil, products trade has shrank to about a third of total trade in oil.
Figure 13 depicts the development of crude and products trade since 1975.