Economics of Short Sea Shipping
Chapter 13
Economics of Short Sea Shipping
Enrico Musso*, Ana Cristina Paixão Casaca† and Ana Rita Lynce‡
1. Introduction
1.1 Purpose
The idea of promoting short sea shipping (SSS) aims at achieving a more sustainable transport network, where least damaging transport modes have a role to play. SSS statistics concerning safety are relatively good when compared with other means of transport.1 It is claimed that the development of SSS is crucial to enhance land-sea intermodality, thus pursuing (i) environmental benefits since it reduces pollution levels and road transport accidents and (ii) economic benefits; within this context SSS reduces transport networks congestion levels, reduces investments in transport infrastructure and increases port hinterlands’ competitiveness the international markets.2
SSS has been growing significantly over the past 40 years mainly due to the growth of intra-regional trade and the boost of hub-and-spoke maritime transport. Its importance is high in the South-East Asia and Europe but other regions of the world are also considering it. The American continent, particularly North America, and Australia are looking carefully at the European experience as a learning process so that they can also implement SSS or coastal shipping as it is called in some regions of the globe. Yet, there seems to be a gap between present growth rate and the goals of policy makers, namely in the European Union (EU). So far, growth seems limited to captive markets, i.e. connections of mainland with islands and deep-sea shipping (DSS) feeder services. SSS does not appear to be a real alternative to land transport, namely road haulage, when intra European trade is being considered. The logistics needs of shippers and just-in-time production philosophies have fostered the road transport usage due to its inherent advantages in detriment of waterborne transport services.
In the light of the above paragraphs, this chapter aims at looking at the European SSS arena not only for the experience gained over the years (i.e. other regions of the world can look at the benefits it offers and what needs to be done towards its implementation), but also because the lack of adequate statistical data from a regional perspective prevents a deeper insight into other SSS geographical areas. To achieve this objective, the present work is structured in five sections. Section 1 presents the purpose of the work, addresses the concept of SSS and shows the lack of consistency in what definitions are concerned. Section 2 concerns SSS market information; it considers modal split, the demand and the supply sides of SSS markets and in doing this it looks at the average size of short sea vessels. Section 3 considers SSS in a multimodal context; it investigates the geographic and economic conditions for integrating SSS in a multimodal transport chain so that a shift of cargo from road to sea takes place, looks at the factors influencing SSS competitiveness, investigates SSS obstacles and challenges and presents a list of possible policies for SSS in a multimodal context. Section 4 investigates the European SSS policies and general policies that support its development and Section 5 concerns conclusions and further comments.
1.2 A definition of short sea shipping
Despite many efforts, the literature still lacks an unambiguous definition of SSS as pointed out by Van de Voorde and Viegas (1995) and Marlow et al. (1997).3,4 Some authors consider it to be the same as cabotage, i.e. all seaborne traffic between ports of the same country, sometimes including frontier ports of adjacent countries5 while others envisage it as an alternative mode to land transport.6 Marlow et al. (1997) presented a tailored definition suitable for specific situations. The authors defined SSS as seaborne flows of all kinds of freight performed by vessels of any flag, from EU Member States to whichever destination within the territory embracing Europe, the Mediterranean and Black Sea non-European countries (see endnote 4). In this regard, Peeters et al. (1995) acknowledged the existence of many regional-based (often European-based) definitions.7
Against this framework, the literature also proposes very pragmatic definitions. Stopford (1997) states that SSS is normally a maritime transport within a region, essentially serving port-to-port feeder traffic which can be in competition with land transport,8 while Bjornland (1993) considers SSS as waterborne movement of goods that does not cross the ocean.9 Sometimes this pragmatism turns to tautology since some authors consider that SSS includes any services which are not considered to be DSS, or which are related to relatively short distances.10,11 Within this perspective, Papadimitriou (2001) considered SSS a maritime transport service that excludes deep sea crossing; instead, the author acknowledged that SSS embraced pure national cabotage services, maritime connections between mainland and the islands, international cabotage services as well as sea-river transport performed by coastal vessels leaving aside the pure inland waterway navigation.12
From a technological viewpoint, some authors focus on ships’ characteristics. Against this perspective Van de Voorde and Viegas (1995) suggested that it would be better to define SSS in terms of trading patterns rather than ships characteristics, since it is not practical from an operational viewpoint the 100% exclusive use of ships in SSS or DSS (see endnote 3). The authors followed Linde’s viewpoint that from a broad perspective considers SSS as a global phenomenon, but from a narrow viewpoint relates the concept to the European SSS which is operated within a large European area and managed by European shipping companies.13–17
The concept of coastal shipping is also addressed by Bagchups and Kuipers (1993) who defined coastal shipping as all forms of maritime transport within Europe and between Europe and adjacent regions, irrespective of whether it involves small oceangoing vessels, large ocean-going vessels or coasters.18 Paixão and Marlow (2002), in an attempt to present a holistic definition, defined SSS as a complex maritime transport service, performed by five classes of ships capable of carrying unitised and non-unitised cargo, offered by different channel intermediaries within well-defined European geographical boundaries (see endnote 16).
At a European policy level, the concept of SSS was addressed in the 1992 communication on the European common transport policy. The European Commission (hereinafter the Commission) envisaged SSS as a means to shift goods from road to sea making use of underused capacity and the document in question does not present a definition of the concept.19 Despite this, in 1992, the Commission defined maritime cabotage as a maritime service that embraced (i) the carriage of passengers and goods by sea between ports situated on the mainland of one Member State without call at islands (mainland cabotage); (ii) offshore supply services; and (iii) services between ports of one Member State where one or more ports are situated on islands (island cabotage).20 The above definition shows that SSS clearly has a broader meaning than maritime cabotage, which seems to have a merely juridical meaning (based on state borders), instead of an economic one (potential competition between sea and land transport). The European SSS definition was first presented in its 1995 communication on SSS.21 In an attempt to harmonise the concept, the European Conference of Ministers of Transport, the United Nations Economic Commission for Europe, and the Commission got together in 2001 and defined SSS as the movement of freight between intra-European ports and between European ports and other ports as long as the latter were located along a coastline bordering Europe as is the case of North Africa.22 An insight into the definition provided by the Commission in 1995 (see endnote 21) clearly shows that both definitions are similar but the recently motorways of the sea (MoS) concept presented by the Commission as the “crème de la crème” of European SSS services23 contributed to increase further the lack of consensus regarding a SSS definition and how these services can be decoupled from MoS services. Following the Commission’s view of the MoS concept as a floating infrastructure, Baird (2007) presented the seaway concept as the ships’ decks where cargo is moved, which can be measured in lane meters and compared with road and rail infrastructure, and raises the issue about public investment in surface transport, given that with a few exceptions the shipbuilding industry cannot be subsidised.24
Consequently, it can be said that so far there is no generally accepted SSS definition, since different criteria are used for defining it, namely (i) geographical criteria (based on the length of maritime leg); (ii) supply criteria (based on type/size of vessels, or on being part of a longer journey); (iii) demand or commercial criteria (competition with land transport; distinction between feeder or intra-regional traffic; nature of cargo); (iv) juridical criteria (ports belonging to the same state). Moreover, some definitions are tailored for a certain geographical space, or for a certain time and correspondent level of technical progress.25 Unfortunately, the numerous and ambiguous definitions imply the non-homogeneity of the (few) available data and statistics, leading to some confusion in the scientific and technical debate. As Wijnolst et al. (1993) point out, statistics are often neither reliable nor consistent, since flows vary considerably according to the definition considered; definitions of import and export may also vary and differences exist also in goods classification criteria.26
The solution to overcome this vagueness can be linked with the possibility to choose an existing definition or proposing an additional one. The best approach should, nevertheless, outline two important keypoints underlying all the definition efforts presented in the literature. One is certainly whether land transport is possible or sea transport has no alternatives (one or both ports being located in an island without tunnels or bridges connecting them). In this case there is a captive market with no or very little competition from other modes (air transport for passengers or some high value-added goods; pipelines for liquid bulks). If a land alternative does exist, this sets a structural difference compared to DSS as for market organisation and competition between substitute issues. The framework proposed in Section 3 addresses this situation. The case for SSS competing with land transport is thus the most interesting from a theoretical viewpoint and for policies and future development.
The second key question is whether SSS is the main leg of a regional intermodal traffic, or a feeder service belonging to a hub-and-spoke cycle based on DSS. While at an intra-regional transport level SSS introduces an intermodal option competing with land transport, at a feeder traffic level it is normally the opposite: the maritime hub-and-spoke cycle is a unimodal solution where SSS competes with land transport feeders (rail or road) which would set an intermodal transport. Most remarks proposed in this chapter apply to both cases. Yet the current debate and policy issues mainly refer to the opportunities of enhancing intermodality based on a SSS leg, while less interest is shown for SSS as feeder traffic to DSS, unless this traffic can be alternatively supplied by SSS or by land transport.
2. Short Sea Shipping Market Information
Over the last four decades, the importance of SSS has been increasing all over the world especially due to the growth of feeder traffic (as a result of growing DSS transport) and the reduction of port calls in the DSS market because of increasing vessel size. With a coastline of about 89,000 kilometres (km), having 60/70% of the industries located within a 150–200 km range from a port, the EU has definitely one of the most suited geographical areas for the development of SSS (see endnote 21). In addition, a transport network made up of 97,600 km of conventional and high speed railway lines, 70,200 km of road infrastructure, 25,000 km of inland waterways (IWW) of which 12,000 km are included in the combined transport network, 439 ports of which 319 are seaports (remaining ones are IWW ports) has made EU one of the most relevant SSS markets in the world, along with Asia. Feeder trade will obviously follow the developments in transhipment hubs, which are rapidly occurring in the Caribbean, Middle East and South America. The next paragraphs provide information about the European SSS market modal split, demand and supply.
2.1 The European Union modal split
Since 1970, freight transport in Europe has grown significantly (see Table 1) as a result of the European economic growth and commercial exchanges taking place at a European and international levels. This trend has been witnessed at a worldwide
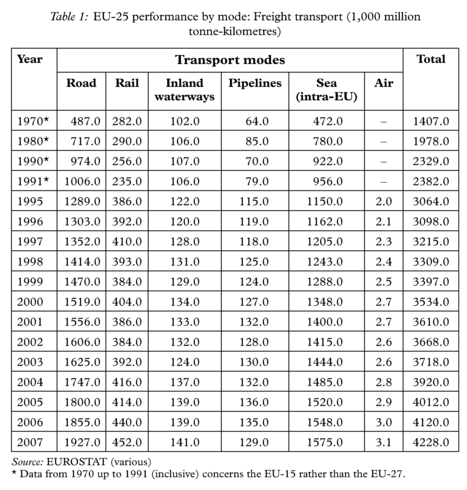
level as shown in the UNCTAD Review of Maritime Transport and Fearnleys market reports. In conformity with Table 1, the movement of freight transport tripled from 1970 until 2006. Over this period the movement of freight by air is very small and has stabilised relatively to the total cargo being moved and according to the data provided in Table 1, it is expected that its share will remain more or less the same.
Freight movement by pipeline has increased in terms of billion tonne-km (tb-km), but from a market perspective it has lost 1.5% between 1970 and 2007. This can be attributed to the use of alternative energies which are more environmentally friendly, in detriment of the fossil oils as well as, to the fact that liquefied natural gas (LNG) is also being transported by waterborne transport, which implies that the pre- and on-carriage legs of the LNG supply chain will make use of pipelines to reach the final consumer. Although the demand for IWW transport has increased over the years, in terms of market share, it has been unable to follow the trends of sea and road transport markets. Data from Table 1 shows that its market share was reduced almost by half. Freight moved by rail has also been subject to a negative trend, even though freight being moved by rail increased from 282.0 tb-km (1970) up to 452.0 tb-km (2007).
As a result, two modes have been responsible for moving freight and for accommodating the growth that has taken place. In 1970, road transport was responsible for moving 487 tb-km, about the same as sea transport. Between 1970 and 1990 freight being moved by road doubled relatively to 1970 (the base year), and the same trend occurred between 1990 and 2007, but within a shorter period of time (16 years). The reason for such a shorter cycle is explained by the 2004 and 2007 enlargements of the EU and because data from 1995 onwards concerns the EU-27 rather than the EU-15. From a market share perspective this growth results from the ability of road transport in absorbing the market share decreases that occurred in rail and IWW, from the SSS inability to meet customers’ needs and from cargo derived from growing market economies. According to 2007 data provided by the EUROSTAT, road transport is responsible for 45.6% of the freight being moved in Europe.
In what concerns sea transport, this mode has not been able to increase its market share despite the effort made by the Commission at a policy level since 1992 in the quest of sustainable alternatives to road transport. Freight being moved by sea also suffered an increase from 472.0 tb-km up to 2007, reaching 1575.0 tb-km. However, the growth cycle appears to be longer. Cargo being moved by sea doubled between 1970 and 1991 (one year more when compared to road), and because of its weaknesses it has increased only 64.7% between 1991 and 2007. The annual average growth since 1995 until 2007 is 2.8% against 3.8% in road transport which explains its market share decrease. After reaching a market share of 40.1% in 1991, SSS share of goods being moved has been decreasing relatively to road transport and in 2007 accounted for a 37.3% of the market. The data also provides no evidence that a reverse of the present trend will materialise in the near future, unless the road is subject to further strict rules and regulations as it does happen in the maritime sector and the small medium sized short sea operators adopt more collaborative strategies among them (see endnote 16). The present economic and financial crisis also does not contribute to change the above mentioned behaviour, and the question raised is how SSS is able to grasp the 14% of freight being moved by long-distance haulage.
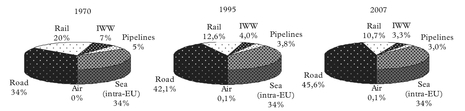
From another perspective SSS accounts for 69% of all international traffic taken place within the EU against 18% performed by road. SSS average journeys are longer (1,385 km) than road (100 km) (see endnote 13). The opposite situation takes place when domestic traffic is considered; here SSS is responsible for carrying 6% of the total tonnes being moved against road transport which carries over 80% of freight. Data provided in Table 1 and Figure 1 also suggest that sea and road market shares should always be under constant monitoring and an analysis between the two of them makes sense in the European arena where more and more focus is given to environmental issues.
SSS competition with land transport, particularly with road, is high due to geographical reasons and due to comparatively highly developed land transport infrastructure. To these factors, others can be added which have very much resulted from economic growth and crisis or policy changes. Examples are the opening of the European internal market in 1992, the restructure of companies’ production and distribution systems, the enlargement of the EU and inventory management strategies like just-in-time, have given to road transport a real boost in its development thanks to its superior flexibility and relatively low prices.27–29 Indeed, sea transport needs to be accommodated
Source: EUROSTAT (various)
* Data from 1970 concerns the EU-15 rather than the EU-27
at specialised infrastructures (i.e. ports/terminals), breaking the overall logistics chain more often than road transportation and preventing, sometimes the information to flow smoothly among the different actors. Nevertheless, one must bear in mind than road infrastructure has been financed by public funds, to a great extent. The considerable difference between the averaged distances performed by SSS and road leads to say they are partially separated up to the distance of 300 km, since it is difficult to find an alternative to road transport inherent flexibility. The railway sector lacks investment, which explains why the potential for SSS for such short distances is not so high, unless the threshold for competitiveness with road transport is considerably shortened. This point is one of the critical issues of the recent EU transport policy as pointed out in the 2001 White Paper.30
The present modal split, where road and sea are responsible for about 82.9% of all freight being moved in 2007 (SSS has been able to keep up with road transport growth) can also be explained by the lack of investment in transport infrastructure since 1975, resulting in numerous bottlenecks and a daily congestion of 7,500 km, even though the Commission has embarked on the development of a comprehensive trans-European transport network to promote the modal shift to underused capacity (rail, SSS and IWW) and of a policy that resulted in the liberalisation of freight rail freight services in January 2007. As for competition with land transport the choice of lift-on-lift-off (Lo-Lo) or roll-on-roll-off (Ro-Ro) operations will depend upon the distances to be covered and port costs incurred (see endnote 16).
2.2 The demand side of the European short sea shipping market
For the purpose of the present study, only data related to cargo/freight will be considered, which implies that the movement of passengers is left out of the analysis. In the European Union 70% of its external trade and 30% of its internal trade goes by sea. Of this 30%, according to Drewry (1993), two-thirds concerns intra-North European traffic, 30% relates to trade between North and South Europe, leaving just a 3.3% of the total short sea trade as pure intra-South European movements.31 This division of the SSS market can be explained by the higher concentration of cargo in the ports located in the Le Havre-Hamburg range, about 70% of the European industry is located mainly in the six original founder EU Member States, and because the North and Baltic Seas very much promote the use of SSS. In what concerns the movement of cargo towards the South of Europe competition with land transport is stronger both for feeder and intra-regional traffic. Channel ports are facing overcapacity due to competition from the Channel Tunnel, while the opening of road haulage to Eastern European firms has provided low cost alternatives to both shipping and railways. This has contributed to a fall in the freight rates squeezing the SSS industry profitability which has been fostered by the pressure that DSS operators exert over short sea operators when negotiating standard shipping services to the final destination.
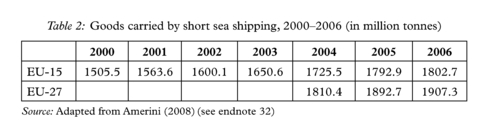
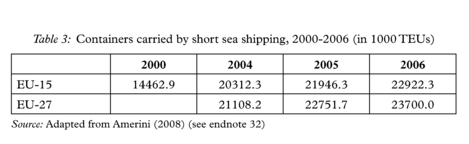
The problem related with the analysis of the SSS demand side concerns the lack of available data at European level; only recently has this issue been addressed subject to Council Directive 95/64/EC of 8.12.1995. Table 2 shows the quantity of cargo being moved by SSS annually between 2000 and 2006. Data concerning EU-15 is available since 2000 and its annual average growth is about 30% and supports the idea that SSS has not been able to grasp cargo from road transport. From an EU-27 perspective little conclusions can be taken since data is only available from 2004 when the former Central and Eastern European countries (CEECs), Malta and Cyprus became EU Member States. The only conclusion possible to be drawn at the present moment is that its annual average growth is about 2.6% which can be explained by these countries geographical location, since the former CEECs rely on road and rail modes rather than on SSS. In 2006, the total goods transported by the EU-27 SSS accounted for more than 1.9 billion tonnes, corresponding to 62% of the maritime trade. Both the North and Mediterranean Seas played a major role in the movement of goods inside the EU, reporting 599 million tonnes (28.1%) and 560 million tonnes (26.3%), respectively.32
From a country perspective, Ireland, Spain and Finland have witnessed the biggest annual average growths between 2000 and 2006, 6.6%, 7.5% and 4.3% respectively (see endnote 32). The Spanish annual growth is explained by the trade performed between the mainland and the islands and because some new ports have been added to the statistics. This situation highlights that the data gathered at an EU level must fill in some gaps, even though it provides a good indication of the cargo being moved. The cargo moved falls within five different categories: liquid bulk, dry bulk, containers, RO-RO units and the cargo which refers to all unknown cargo. The analysis that follows has been carried out from an EU-27 perspective.
According to 2006 data, the bulk market represents 69.2% of the cargo being moved by SSS, and seen from an individual perspective, the liquid bulk and the dry bulk short sea markets account for 49.5% and 19.7%, respectively, of the whole cargo being moved by sea (see endnote 32). These figures are in line with the 2007 statistical data provided by Drewry, where the liquid bulk and dry bulk short sea markets accounted for 50% and 20% of the overall cargo being moved on that year.33 The main active countries in the liquid bulk market are France, Italy, the Netherlands and the United Kingdom (UK). Together they handled 624.3 million tonnes equivalent to 66.2% of
the liquid bulk short sea market. As far as the dry bulk short sea market is concerned, Spain, Italy, the Netherlands and the UK dominate, and most dry bulk cargo is transported in cargo sizes of 1,000 and 2,000 tonnes subject to long term and spot voyage contracts.34 Likewise, they handled 200.7 million tonnes (53.3% of the dry bulk short sea market).
Ro-Ro units follow the dry bulk short sea market (12.8%). This can be explained by the high concentration of ferry vessels’ operations in the North and Baltic Seas. Germany, Italy, Sweden and the UK are responsible for the biggest share of units being handled. Together, they handled 206.0 million tonnes equivalent to 84.2% of the Ro-Ro short sea market. Interesting to see that the data for EU-15 and EU-27 are very close to one another which suggests that the new countries had a very low impact on the cargo being moved in this market segment. Most of the countries cases are self explanatory but in the case of the UK, it should be highlighted that the country is a gateway for cargo originated from/destined to Ireland which makes use of a sea-road transport system to/from mainland Europe.
Container short sea market ranks in the fourth place and has presented a 10.5% market share for both 2006 and 2007 (see endnotes 32, 33). Germany, Italy, the Netherlands and Spain dominate the container short sea market, and this is highly explained by the geographical location. In the case of Italy, the country is strategically located in the Mediterranean to the extent that divides it into two navigational areas the Eastern Med and the Western Med, and this can very much be attributed to the position of Gioia Tauro container terminal that serves about 55 different Mediterranean ports. Germany is a gateway to the Baltic and to the CEECs. The four countries handle 152.2 million tonnes which represents 76.2% of the market. Despite being in fourth place, the market for the EU-15 has witnessed an 8% annual average growth rate (see endnote 32). This explains why the container short sea market is reported to be one of the most dynamic markets of the shipping industry, both in feeder traffic and intra-regional trade.
The number of containers being moved on an annual basis can be seen in Table 3. The annual average growth rate is not provided by Amerini (2008) but the data provided shows that the number of containers did not increased considerably after the enlargement, which suggests that well strategically located ports in the EU-15 geographical area were already responsible for handling cargo particularly destined to the Central Eastern European Countries. Moreover, the number of TEUs reported empty provides empirical evidence to sustain the presence of unbalanced trades as shown in other studies caused by density of population, separation of production and consumption markets, type of goods and alternative infrastructure.35–36 Germany, Spain, the Netherlands and the UK greatly contribute to this situation due to their hub-and-feeder status, and which contributes to increase the freight rates charged to the final end user.
Finally, Spain, Italy, the Netherlands and the UK are responsible for the biggest share of other cargo, totalising 72.8 million tonnes or 50.9% of the market.
Absolute trade volumes continue to rise in Europe. Growth of trade patterns will create additional demand for SSS movements and additional demand for feeder vessels. The expanding economies of the Commonwealth of Independent States (CIS) countries present further opportunities for the European SSS sector, which can only be fostered through the implementation of strict environmental controls to reduce the amount of emissions into the atmosphere. Ro-Ro and the container market offer potential for modal shift as together they account for 23.3% of the goods being moved by sea, and because the market is far from having reached a mature state. In the case of containerised cargo, the market shows a service gap since shippers have not been offered the desirable service frequency they claim since the volumes being moved are insufficient and that explains why so many containers are being moved by road.
From a port perspective, Rotterdam accounts for the biggest share of cargo handled through ports (7.4%) to be followed by Antwerp, Marseilles, Hamburg and Le Havre, most of them located in the Le Havre–Hamburg geographical range. What is interesting to see in this overall picture is that Rotterdam handled more SSS cargo (184.4 million tonnes) than deep sea cargo (168.4 million tonnes) (see endnote 32), which shows how important Rotterdam is to the overall European SSS market.
2.3 The supply side of the European short sea shipping market
The high number of journeys (of normally less than four days, e.g. the ferries that ply the Baltic Sea and the English Channel) makes management and organisation costs of SSS comparatively high, although the cost structure is very different for feeder and intra-regional markets. In the first case, costs are mainly vessel related: capital (or charter), operating and voyage costs. Overhead and administration costs are relatively small. Consequently, feeder carriers rely mostly upon chartered vessels (with the exception of a few Asian carriers).37 In the second case, the carrier involved in intra-regional intermodal SSS will bear high costs for handling cargo and providing land transport. Administrative overhead costs will also be higher. Despite these technicalities, the definition of what is a short sea vessel is a subject of much debate since different authors present different definitions.
Hoogerbeets and Melissen (1993), state that the European SSS can be divided into three main ships’ categories: the traditional single-deck bulk carriers, the container-feeder vessels and the ferries.38 Crilley and Dean (1993) report that vessels operating in the SSS market have frequently been defined as sea-going cargo-carrying ships that transported both freight and passengers with a gross tonnage (GT) less than 5,000, and that ships with a GT less than 100, non-propelled vessels, and harbour or IWW vessels were not part of the definition.39 Peeters et al. (1995) created a splitting line between short sea and deep sea vessels. The authors considered that the former comprehend all ships whose deadweight capacity is less than or equal to 10,000 deadweight tonnes (dwt) which is equivalent to an average ship of about of about 8,000 GT (see endnote 7).
Marlow et al. (1997) pointed out that the SSS fleet is normally identifiable as a number of carriers with similar characteristics (SSS is usually performed by vessels up to a certain size and conversely vessels up to a certain size are usually deployed in SSS). Even if these parameters are likely to change significantly over time, they estimate that SSS include tankers and bulk carriers up to 13,000 GT and/or 20,000 dwt; general cargo and break bulk carriers up to 10,000 GT and/or 10,000 dwt; and combined passenger/cargo ships and Ro-Ro vessels between 1,000 GT and/or 500 dwt and 30,000 GT and/or 15,000 dwt (see endnote 4). Stopford in 1997 considered SSS vessels to be within the 400 to 6,000 dwt range against some authors that talk about 10000+ dwt (see endnote 8).
Paixão and Marlow (2002) identified five types of SSS vessel categories (i.e. the traditional single-deck bulk carriers, the ferries, container feeder vessels, a fleet of bulk carriers and tankers and sea-river ships often with retractable wheelhouses), provided and individual description of each of the vessels and investigated the differences between Lo-Lo and Ro-Ro operations (see endnote 16). This classification which partly agrees with the one provided by Hoogerbeets and Melissen (1993), is similar to the one provided by Verlaat (2008) (see endnote 38).40 The difference between Verlaat and Paixão and Marlow is that the former considered the fleet of tankers, dry bulk carriers and traditional single-deck bulk carriers often used in the carriage of neo bulk within the same category of conventional ships.
Besides the traditional ships mentioned in the above paragraphs, the short sea market has been witnessing a trend towards the introduction of faster ships such as wave pierce catamarans, air cushion vehicles, hydrofoil, surface effect ships, and the small waterplane area twin hull (SWATH). Their main problem concerns their consumption levels to perform their designed service speed; any increase in their speed means an increase in the cost of bunkers, a decrease in their cargo carrying capacity meaning a revenue reduction. The question to be raised at this point is to ask shippers about their interest in having their cargoes being moved by this type of vessels. Despite being able to shorten cargo transit times and provide high service levels, how far they are willing to pay higher freight rates when Becker et al. (2004) recognised that the high speed vessel market offers potential to compete with certain road transport market segments.41
Overall, short sea ships are normally much smaller than deep sea ones although there is a trend towards an increased vessel size. Several reasons explain why such vessels are small: (i) demand is normally weak for SSS routes; and (ii) the high number of short journeys requires smaller ships in order not to spend too much time in port calls. The lack of an unambiguous definition, towards the size and types of ships that work in the SSS market, causes additional problems when authors try to characterise the fleet operating in this market which may be a reason why most studies on fleet analysis set the dividing line between SSS and DSS at 10,000 dwt or 6,000 GT.
According to a Lloyd’s Register survey quoted in Peeters et al. (1995), by the end of 1992, the world SSS fleet amounted to 68.5% of the existing fleet corresponding to 9.6% in terms of GT, 8.9% in terms of the total dwt carrying capacity with an average size equal to 1,319 GT. From a European perspective, the same survey estimated that the European SSS fleet amounted to 57.3% of the existing European fleet corresponding to 7.9% in terms of GT, 6.7% in terms of the total dwt carrying capacity with an average size equal to 1654 GT. The figures reported on ships which are supposed to be employed in SSS show that on a worldwide basis there seems to be a quite constant share of ships employed in SSS, as well as in terms of GT and dwt. The same survey showed that general cargo and liquid bulk carriers prevail in the EU SSS fleet. Peeters et al. went on saying that the average age of the world SSS fleet was 18 years, two years younger than the European one that amounted to 20 years (see endnote 7).
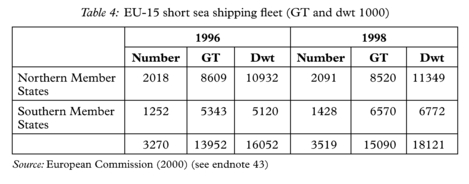
The Colton Company (1997) estimated that the European SSS fleet was made up of 5,650 units embracing 5,000 sea-river ships often with a retractable wheel house, 400 containerships ranging between 100 and 700 TEUs and 250 Ro-Ro ships. Most popular container ships moved 200 TEUs and the most popular sizes of sea-river ships presented deadweight capacities between 1,500 and 2,200 tonnes.42 However, the data provided presents two main problems since the short sea dry and liquid bulk carrier fleet was left out of the calculations and there is no reference to the year that the data relates to. The Commission in its report on the implementation of Council Regulation 3577/92, presented data relatively to the 1996 and 1998 SSS fleet (see Table 4), and considered for this purpose ships of less than 10,000 dwt.43
The data supplied by the Commission does not discriminate the type of ships being considered which prevents from having a real perception of the composition of the actual fleet. What type of ships predominate in each group of Member States is unknown and even if the ratio of dwt to GT were to be used to identify if the fleet is mainly formed by passenger/cargo ferry and Ro-Ro (ratio of dwt to GT below 1) or by tankers and dry cargo vessels (ratio of dwt to GT above 1), its outcome would be far from being a reliable one. The data supplied by the Commission also shows no evidence that sea-river ships have been included in the calculations and so, the number of ships calculated for 1998 are well below those estimated by the Colton Company in 1997.
The only possible conclusion is that the SSS fleet has increased in numbers and in dimension but very slightly. The average SSS vessel size in terms of GT and dwt for 1996 were 4,267 and 4,909, respectively and that the figures for 1997 amount to 4,288 and 5,149, respectively. Various studies on the SSS have observed a gradual increase in the average size of the SSS vessel. According to Dynamar quoted in Peeters et al. the SSS vessel average size increased from 1,400 dwt in 1970 up to 2,000 dwt in 1980, and up to 2,400 dwt in 1990 (see endnote 7).
According to Lloyd’s Marine Intelligence Unit (LMIU) quoted in Wijnolst (2005) the 2003 European SSS fleet from Baltic Sea to the Black Sea comprehended 10,000 ships between 500 and 10,000 GT of which 3,825 and 2,110 ships were older than 25 and 30 years, respectively and that a total of 3,460 shipowners operated in the European short sea market.44 Part of the 2004 world short sea fleet can be seen in Table 5 since vessels operating on the SSS were aggregated in eight different categories, rather than in ten as shown in Table 6. Smits left out the general cargo and ropax fleets which according to the 2007 data represent about 47% of the world short sea fleet and all vessels below 1000 dwt which are about 10,000 vessels,45 and such a situation
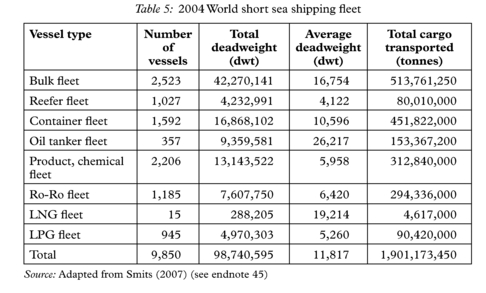
creates a distortion relatively to the 2003 data. Nevertheless, if the percentage split provided by Peeters et al. (1995) is applied, (i.e. the EU-27 short sea fleet amounts to 31.5% of the world short sea fleet) what can be said is that the European short sea fleet embraces about 9166 vessels including those with a deadweight below 1,000 tonnes. Shipowners based in Germany, the Netherlands Greece and Italy dominate the market and control 62% of this short sea fleet.46
Table 5 also provides the average deadweight for the eight vessel segments, and what can be said is that short sea vessels’ sizes have increased for the past years, which meet the findings reached by Marlow et al. in 1997 (see endnote 4). The added value of Table 5 rests on its ability to provide more detailed information for the different types of cargo being moved by sea rather than the statistics provided by the EUROSTAT, but prevents possible comparisons with the data gathered by other consultancy houses and/ or eventually EUROSTAT.
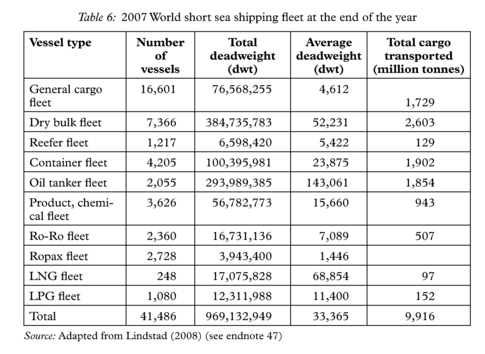
The Lloyd’s Fairplay data of the worldwide short sea fleet quoted in Lindstad (2008), shows that at the end of 2007, the world short sea fleet includes 10 vessel categories and is much more accurate than the 2004 data.47 With the assumption that the EU-27 short sea fleet represents 31.5% of the world short sea fleet, it can be estimated that the EU-27 short sea fleet has about 13,050 units, which means an average yearly growth of 7.6% relatively to 2003 where data quoted in Wijnolst (2005) was provided by LMIU. The average size of short sea vessels goes on increasing and against the findings of Corres and Psaraftis who estimated the average size of short sea vessels to be around 11,000 dwt by 2007–2008,48 the average size appears to be within the range of above 30,000+ dwt, much at the expense of the tanker fleet size employed in the SSS market.
The biggest problem of the European short sea fleet is still its age and the main concern of an ageing short sea fleet is its pollutant emissions which in 2000 accounted for 36% of the total nitrogen oxide (NOx) and 6% of total greenhouse emissions. The problem of an ageing short sea fleet is not new, since it has already been mentioned by Øvrebø in 1969 (see endnote 25) and more recently by Lowry in 2008 who identified that the dry bulk short sea fleet had an average age of 31 years (see endnote 34). This suggests that a renewal scheme is desirable for SSS to be competitive with road transport and to be integrated into multimodal/intermodal transport chains. The absence of legislative measures enforcing the renewal of the fleet has been a negative influence since until recently the dwt of most short sea vessels was under 5,000. Moreover, short sea operators do not possess sufficient funds to embark on a short sea fleet renewal programme, the costs of building a small ship are four-and-a-half times more per dwt, and bank credit is very expensive (see endnote 48).
The resultant reduced profitability is therefore a serious strategic concern in capital intensive companies planning for growth and the renewals that have taken place result more often than not from the existing rivalry between shipowners operating in this market, from port state control inspections and the enforcement of important legislation to protect the environment. Most focus has been giving to the development of efficient vessels ranging from 30,000 up to 300,000 dwt while the SSS fleet has been more or less neglected. Nevertheless, this trend has started to reverse due to the numerous research and development projects being funded by the European Commission in last years in the quest for more efficient ships such as the CREATE3S new generation of short sea vessels,49 the ENISYS ship concept50 or generic short sea vessels based on a common platform and built in series as it happened in the past (see endnote 48). In 1994, Wijnolst et al. had already acknowledged that SSS technology and operations needed to be changed before any significant modal split materialised.51
The point is that new ships are needed to compete with road transport on cost, speed, flexibility, reliability without jeopardising safety and the environment, attractive sailing times, maintained transit times, and guarantee of delivery. Two key aspects that these ships must target are the reduction of the turnaround time in port and the ability to develop intermodal solutions that meet the needs of the entire logistics chains. If significant reductions of 20–25% are achieved in terms of cost and lead time a modal shift is expected to occur (see endnote 50), an improvement relatively to the 35% reduction required to shift cargo from road to sea as suggested by APAS in 1996.52 Under the present environment and taking into account the modal split presented in Figure 1, an analysis of SSS in a multimodal supply chain context makes sense in the European arena, as competition with land transport is higher due to geographical reasons and to the comparatively highly developed land transport infrastructure.
3. Short Sea Shipping in a Multimodal Supply Chain Context
3.1 Geographic and economic conditions for developing short sea shipping: a theoretical framework
Maritime transport is normally part of a transport cycle involving other transport modes. The maritime leg can be a complex cycle, when organised from a hub-and-spoke perspective, involving ships of different size to attain economies of scale/density on some routes. Since the goal is to attain the cheapest, fastest and most reliable transport conditions (i.e. to minimise the generalised cost), the demand for sea transport is related to the generalised cost of the whole transport cycle. From a microeconomic approach, the use of generalised costs explain the user’s choice (i.e. providing transport solutions for producers), but the use of total costs (including infrastructure and external costs) from a macroeconomic approach explain general utility enabling a shift of volumes from congestioned land infrastructure to sea.