Discounted Cash Flow Analysis and Royalty Rates
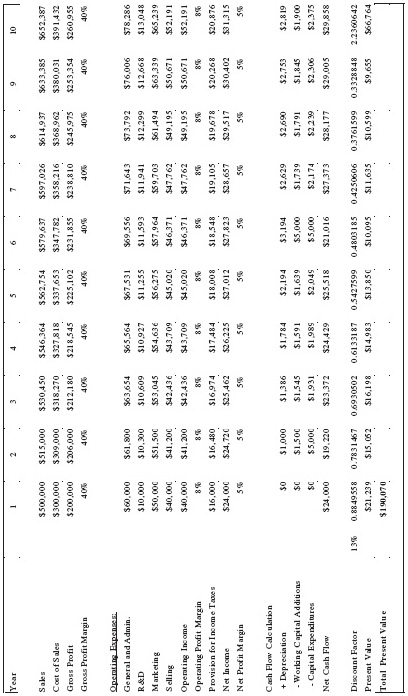
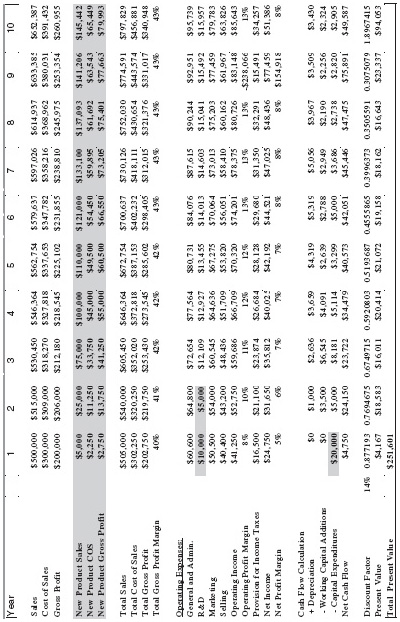
Chapter 10 A variation of the investment rate-of-return analysis can also be used for royalty rate derivation. This alternate method makes use of a discounted cash flow analysis, which converts a stream of expected cash flow into a present value. The conversion is accomplished by using a discount rate, reflecting the risk of the expected cash flow. In addition to the benefits previously listed, from using an investment rate-of-return analysis, the discounted cash flow analysis also reflects the The basis of all value is cash. The net amount of cash flow thrown-off by a business is central to corporate value. Net cash flow, also called “free cash flow,” is the amount of cash remaining, after reinvestment in the business, to sustain continued viability of the business. Net cash flow can be used for dividends, charity contributions, or diversification investments. Net cash flow is not needed to continue fueling the business. Aggregation of all future net cash flow derived from operating the business, modified with respect to the time value of money, represents the value of a business. A basic, net cash flow calculation is depicted below: NET SALES minus MANUFACTURING COSTS equals GROSS PROFITS GROSS PROFITS minus MARKETING EXPENSES and GENERAL OVERHEAD EXPENSES and ADMINISTRATION EXPENSES and SELLING EXPENSES equals OPERATING PROFITS OPERATING PROFITS minus INCOME TAXES equals NET INCOME NET INCOME plus DEPRECIATION equals GROSS CASH FLOW GROSS CASH FLOW minus ADDITIONS TO WORKING CAPITAL and ADDITIONS TO FIXED PLANT INVESTMENT equals NET CASH FLOW Sales represent the revenue dollars collected by the company from providing products or services to customers. Net sales is the amount of revenue that remains after discounts, returns, and refunds. Manufacturing costs are the primary costs associated with making or providing the product or service. Included in this expense category are expenses associated with labor, raw materials, manufacturing plant costs, and all other expenses directly related to transforming raw materials into finished goods. Gross profit is the difference between net sales and manufacturing costs. The level of gross profits reflects manufacturing efficiencies and a general level of product profitability. It does not, however, reflect the ultimate commercial success of a product or service. Many other expenses associated with commercial success are not accounted for at the gross profit level. Other expenses contributing to successful commercialization of a product include Operating profits reflect the amount left over after non-manufacturing expenses are subtracted from gross profits. Income taxes are expense of doing business, and must be accounted for in valuing any business initiative. Depreciation expense is calculated based on the remaining useful life of equipment purchased for business purposes. It is a non-cash expense that allocates the original amount invested in fixed assets to annual operations. Depreciation is calculated to account for the deterioration of fixed assets, as they are used to produce, market, sell, deliver, and administer the process of generating sales. Depreciation accounts for the using-up of assets. It is called a “non-cash” expense, because the cash associated with the expense was disbursed long ago, at the time that fixed assets were purchased and installed. The depreciation expense is subtracted before reaching operating profit, so that income taxes will reflect depreciation as an expense of doing business. Gross cash flow is calculated by adding the depreciation expense, previously subtracted to calculated operating income, back into the after-tax income of the business. Gross cash flow represents the total amount of cash that the business generates each year. Additions to working capital, and additions to fixed plant investment, are investments in the business required to fuel continued production capabilities. Net cash flow is everything that remains of gross cash flow, after accounting for reinvestment in the business for fixed plant and working capital additions. Consider the discounted cash flow analyses, presented in Exhibits 10.1 through 10.4, as a simple example of using discounted cash flow analysis for royalty rate derivation, where the licensed technology is on the cusp of commercialization. Exhibit 10.1 represents the future net cash flow for Generic and Mature Commodity Corporation, as it currently operates. The sales, expenses, and earnings for the company reflect the commodity-like nature of the current business and its products. Product prices are under pressure from strong competition, translating into low profitability. Strong competition also severely limits the opportunity for the company to achieve any substantial growth in the future. The present value calculation, contained in Exhibit 10.1, shows a value for the company at $190 million, using a discount rate of thirteen percent. The calculation of the value of the company includes the present value of the net cash flow expected after year eleven. Constant growth, reflecting inflation and minimal volume growth in perpetuity, is captured in the eleventh year’s discount rate factor. The $190 million value equals the aggregate value of all the assets of the company. This amount indicates that the company has earned its required weighted average cost of capital, and an excess present value of $190 million. Generic and Mature Commodity Corporation is planning to embark on a major business initiative, with the introduction of a patented product using new technology, changing itself into a company that has both commodity and fast-growth products. It will continue to offer its commodity product, but will add a new, proprietary product to its offerings. The underlying technology for the new product will be licensed from another company. Exhibit 10.2 represents the present value of the company, including the net cash flow from the existing operations, and the net cash flow from the new product initiative. Additional sales, manufacturing costs, and expenses are reflected in the analysis. Additions to working capital, and fixed assets required for the new product commercialization effort, are also reflected. EXHIBIT 10.2 (DCF #2) Generic and Mature Commodity Corp. with New Product Based on Licensed Technology Business Enterprise Value Without Royalty Payment Included in the analysis are research and development expenses, needed to prove the technology, and obtain FDA approvals.1 As a result of the initiative, the present value of the company increases to $251.6 million. The higher value reflects the added revenue and earnings of the new product, at the higher profit margins of the new product. A comparison of Exhibit 10.1 and Exhibit 10.2 shows that research, marketing, working capital additions, and fixed asset additions are all higher—and by more than just a proportional share of the higher sales forecasts. This is especially true for the early years in the discounted cash flow analysis, because the new product initially does not contribute significant sales volume, but definitely has expenses. What royalty rate should the company pay for use of the new product technology? The highest amount of royalty the company should be willing to pay for the licensed technology is shown in Exhibit 10.3
Discounted Cash Flow Analysis and Royalty Rates
GENERIC AND MATURE COMMODITY CORPORATE VALUE
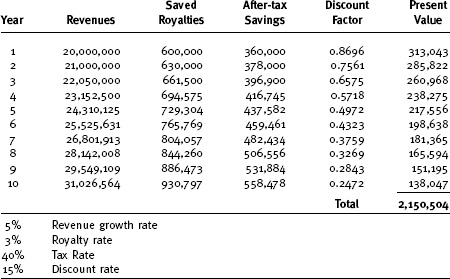
NEW PHARMAPROD CORPORATION ROYALTY RATE