Characteristics and the Presence of Women on the Board of Directors: The Case of the Greek Shipping Sector
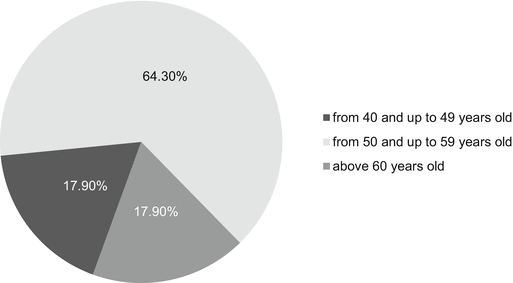
Fig. 1
Number of Greek Maritime Listed Companies (2001–2012)
3.2 Variables Analyzed
The study examined the following variables for the period 2001–2012:
CEO Duality, as of December 31st of each year, was captured by examining whether the CEO was also the Chairperson, or whether the two positions were separate.
Board Size was measured by capturing the number of serving directors of each company, as of December 31st of each year.
Average Board Size was measured by calculating the average of each company’s board size, throughout the years.
External Independent Directors was measured by calculating the sum of all Independent Directors that served on the Boards of the Companies.
Average Tenure of the Board members was measured by calculating the sum of the serving period (in months) of all directors (including Chairman and CEO), divided by their total number for each company.
Average Tenure of Board Members (in months) was measured as the “Average Tenure of the Board”, but excluding the Chairperson(s) and the CEO(s).
Average Tenure of Chairpersons and Average Tenure of CEOs was measured by calculating the sum of the serving period (in months) for the Chairpersons or CEOs of each company, divided by the total number of Chairpersons or CEOs that served in each of the companies throughout the years.
Board Member age was captured by recording the date of birth of directors and calculating their age for December 31st 2012.
Age of the Chairpersons and the CEOs was captured by recording their date of birth and calculating their age by the end of each year, for the period 2001–2012.
The gender of Chairpersons and CEOs was identified by their full names.
Cross Directorships were identified by the directors that were serving in more than one board simultaneously, and recorded along with the corresponding companies.
Total Board Memberships was captured for the whole sample, by the number of all directorships through the years. This particular variable captures the number of positions/seats that Boards have, rather than the number of persons (individual directors) that occupy them.
Total Male Board Memberships (for the whole population and all years) was captured by the absolute number of male directorships that existed within the Boards through the years. The exact number was ascertained by examining both their names and surnames. Further, we calculated the total male board members, by excluding any cross directorships and/or mobility.
Total Female Board Memberships (for the whole population and all years) was captured by the absolute number of female directorships that existed within the Boards through the years. The exact number was ascertained by examining their names and surnames. Additionally, we calculated the total female board members by excluding any cross directorships or/and mobility.
Total Board Members was calculated by excluding any mobility and/or cross directorships from the total board memberships. This variable captures the absolute number of directors that serve as board members in one or more companies.
The number of Chairpersons and CEOs was calculated by counting the absolute number of Chairpersons and CEOs respectively, for each company through the years.
3.3 Greek Shipping Context
Greece is a global leader in the maritime industry and the Greek ship-owners are well known for their entrepreneurial skills. Boston Consulting Group (2013) revealed that Greek-owned fleets rank first in the world in total capacity, and Greek owners control more than 4,000 ships, whereas Petrofin Research (2013) found that there were 690 Greek-based ship management companies in 2013.
Greek ship-owners’ foresight is particularly evident when shipping is getting drowned by bursting credit and commodity bubbles. There are shipping families that count up to seven generations of maritime expertise, and have been considered as the most dominant shipping dynasties of the world. Strong family ties in ownership, informal networks and clustering, are an important uniqueness of the sector. In the last 9 years, a number of Greek shipping firms have gone public, and altered their way of being organized and managed; it is very interesting to depict what a board in this sector looks like. According to the Foundation for Economic & Industrial Research (2013), more than 52 % of the shipping companies listed in NYSE and NASDAQ by the end of 2012, were owned by Greek nationals.
4 Findings
4.1 Board Demographics
4.1.1 CEO Duality
In our study, the CEO duality/separation was examined at the end of December for the period 2001–2012. Figure 2 illustrates that across the years, there is a tendency for many companies towards a more concentrating structure of governance, where the Chair and the CEO is the same individual. In 15 (53.6 %) out of the 28 companies listed in Stock Exchanges for the end of 2012, CEO and Chairperson positions were in control of one person.
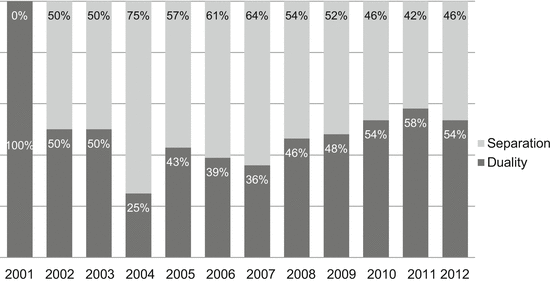

Fig. 2
CEO duality vs separation for the period (2001–2012)
4.1.2 Board Size
For the period 2001–2012, the average board size was 6.61, noting that most companies prefer a board between 6 and 7 members, as depicted in Fig. 3. A board of 7 members seems to be the preferred size for a large majority of companies (44.1 %), followed by a board of 6 members (17.6 %). The smallest board comprised 4 members, and the largest 10. If we look solely at the companies that were listed in the stock exchanges for 2012, we note that for these 28 companies, the findings are similar to the 34 companies examined in the period 2001–2012, since these companies prefer a BOD between 6 and 7 members.
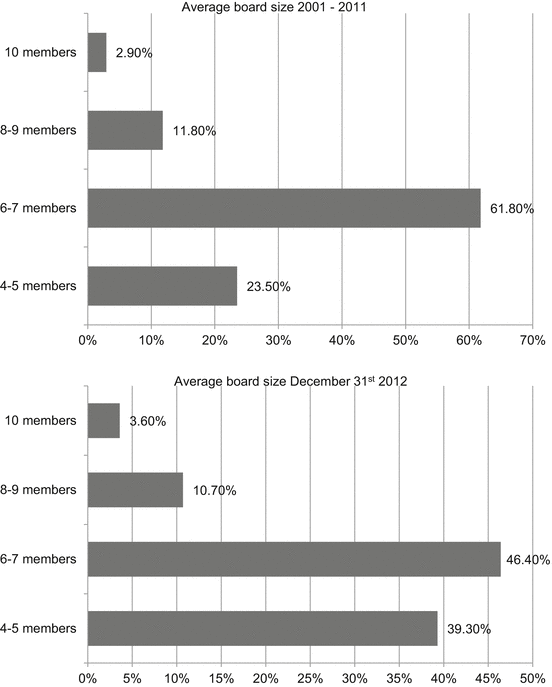

Fig. 3
Average board size for the period 2001–2012 and for the year ended December 31st 2012
We should also note that the average board size, as of December 31st each year, fluctuated from 6 to 9 members in the years 2001–2012 (Fig. 4).
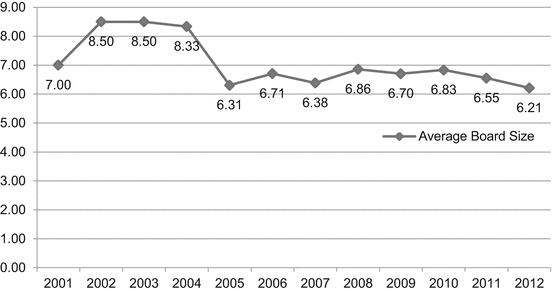

Fig. 4
Yearly average board size as of December 31st
4.1.3 External Independent Directors
For the 305 BOD positions that were created in these 12 years, 174 seats were occupied by Independent Directors (Fig. 5). If we focus solely on the 259 BOD persons (and not positions) that served in the boards all these years, we deduce that 57.52 % of the Directors are Independent. It is interesting to note that out of the 32 Chairperson positions that were created in these years, there were 9 Independent Chairpersons (28.1 %). However, for the 42 CEO positions, there were no Independent CEOs.
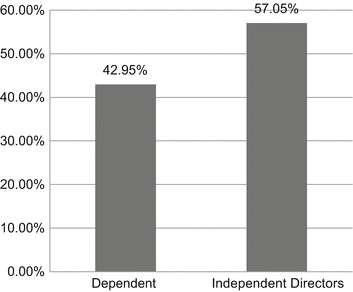

Fig. 5
Dependent vs independent directorships
4.1.4 Cross Directorships
For the period 2001–2012, we found 305 directorships, of which 84 were held by 38 directors who possessed simultaneous positions in two or more different listed companies’ Boards during their tenure. Out of these 38 directors, there were 30 (78.9 %) who held positions in 2 different boards, while 8 (21.1 %) directors served in three companies.
The total number of directorships by chairpersons for these twelve (12) years was 41, while the exact number of Chairpersons was 32, due to cross directorships. It is notable, that in 29 out of the 34 companies (85.3 %), there was no change of the Chairperson during the examined period. For the rest of the companies, it was found that 4 companies had changed their Chairperson once and 1 company twice. The total number of CEO positions was 42, while the exact number of CEOs was 33, due to cross directorships. There were 27 companies (79.4 %) that did not change their CEO at all, 4 changed only once, and 3 that replaced the person twice.
4.2 Demographics
4.2.1 Board Tenure
For the year 2012, we found 14 departures of BOD Members. Four new BOD members were appointed in the respective companies, and if we incorporate the BOD members of the newly formed company GAS LOG, we find 13 new appointments of Directors. For the top positions in the Board, we noticed only 2 CEO appointments and only 1 departure. No change took place in any Chairman’s position.
The average tenure of the board members varies significantly from company to company, and this could be explained by the diversity that exists on the year that each company listed in a Stock Exchange. The average Tenure of the whole Board is 48.33 months, with a standard deviation of 22.2. An equal percentage of 35.3 % has average tenure from 2 to 4 years and from 4 to 6 years (Fig. 6).
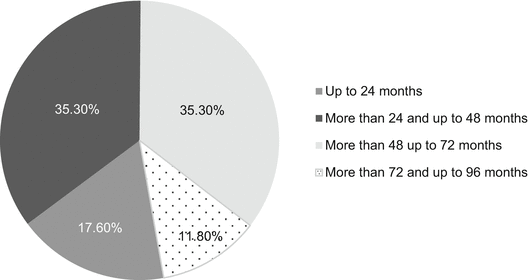

Fig. 6
Average tenure of the whole board (n = 34)
The average Tenure of Directors, after excluding the tenure of the Chairman and CEO, was 58.58 months, with a very high standard deviation of 74.93.
Interestingly, the average Tenure of CEO (Fig. 7) was 57.32 months, with a standard deviation of 32.67 months. More than half of these companies (58.8 %) have CEOs with high tenure, since they served in this position more than 4 years. In some companies (8.8 %), the CEO has served the company for approximately 10 years.
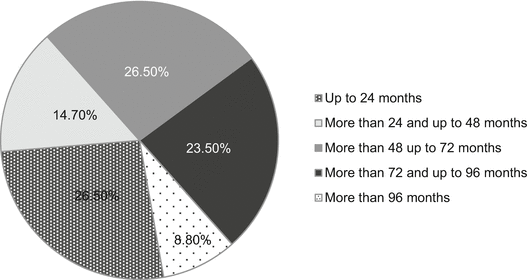

Fig. 7
Average tenure of the CEO (n = 34)
As for the average Tenure of the Chairperson (Fig. 8), we note that it had an average of 59.34, with a standard deviation of 30.70 months. Listed shipping companies have Chairpersons with a high tenure, and we note that 67.6 % of these companies have Chairpersons who serve for more than 4 years in the Board. In one company, the Chairperson served for approximately 10 years, and in another one, the Chairperson had tenure of approximately 11 years.
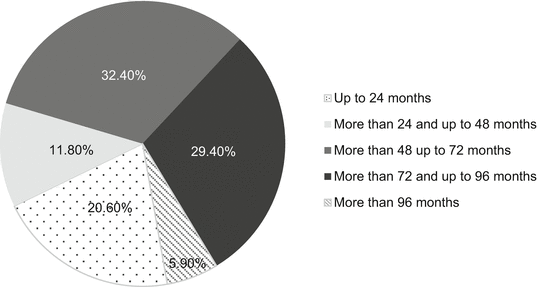

Fig. 8
Average tenure of the chairperson (n = 34)
4.2.2 Age
Figure 9 presents the distribution of age of all directors on a board of the 28 companies which were listed in the Stock Exchanges on December 31st 2012. Our findings showcase that the average age of directors who hold positions in the Board as of December 31st 2012, was 55.5 years old. The majority (64.3 %) of the companies had directors between 50 and 59 years old.


Fig. 9
Average age of directors in Greek Maritime Companies (n = 28, mean = 55.5 and SD = 5.6)
At the end of 2012, the average Chairperson’s age is 50 years old, while the CEO’s is 56 years old. The two youngest CEOs were 35 years old and the oldest CEO was 71 years old. Besides, the younger Chairperson was 42 and the oldest, 80 years old.
4.2.3 Gender
For the 34 companies examined in the period 2001–2012, 292 out of 305 directorships (BOD positions) were held by men, with an average of 8.6 per company. Respectively, there were only 13 directorships held by women, with an average of 0.4. The sharp discrepancy that exists between men and women in the board composition is depicted in Table 1.