Carbon Losses Due to Wood Harvesting and the Role of Wood Products

Fig. 7.1
Temporal trends of wood harvested from forests in Italy (data source ISTAT)
However, since resulting forest wood harvesting aggregated statistics apparently underestimate real wood production, the whole reporting system was frequently criticized in literature (Cutolo 2000; Corona et al. 2004). Forest owners may in fact communicate clearcuts smaller than the effective ones avoiding the cost of a formal harvesting project and simply cutting in a larger area. Just a few clearcuts are verified in the field by local authorities.
It is evident that since updated forest wood harvesting statistics are so important in supporting strategic forest planning actions, an accurate, cheap and feasible monitoring system should be implemented. The integrated use of remote sensing technologies should be considered. The results recently published in Chirici et al. (2011) are here synthesized.
7.2.2 Remote Sensing for Harvesting Monitoring
Monitoring of forest disturbances by remote sensing is usually implemented through the use of change detection techniques (e.g. Coppin et al. 2004; Lu et al. 2004).
Forest harvesting monitoring through satellite image analysis is reported for the tropics (e.g. Souza et al. 2005), USA (e.g. Schroeder et al. 2007), Canada (e.g. Wulder et al. 2007), and boreal Europe (e.g. Heikkonen and Varjo 2004).
Chirici et al. (2011) presented the first study specifically oriented to satellite monitoring of wood harvesting in coppice forests. The authors tested manual and semi-automatic methods to define a correction coefficient to be applied to official statistics in order to obtain a more reliable data on annual harvested extents.
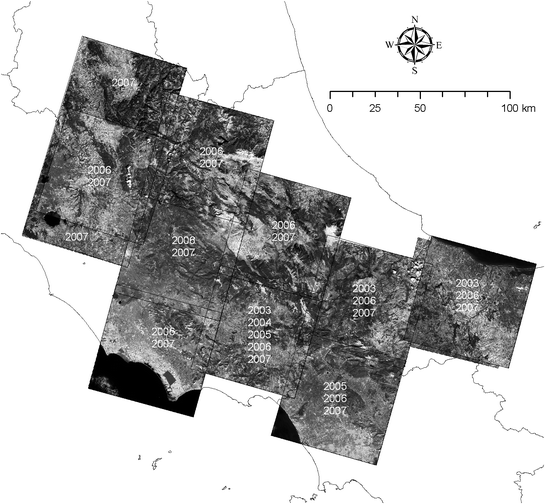
The test was carried out within the framework of the project Global Monitoring for Environment and Security (GMES) Service Element Forest Monitoring in a test area of 34,000 km2 located in central Italy. The area was covered by multitemporal SPOT5 HRG images (Fig. 7.2).


Fig. 7.2
A mosaic of some of the SPOT5 HRG images (band 4 in the near infrared channel). For each area the dates of the images used in the study are also reported (from Chirici et al. 2011 modified)
Coppice forests were dominated by oaks managed with a rotation period of about 20 years. Chirici et al. (2011) compared the visual on-screen photo-interpretation of infrared false color composite SPOT5 HRG images with semi-automatic classification systems based on both pixel-based and object-based approaches.
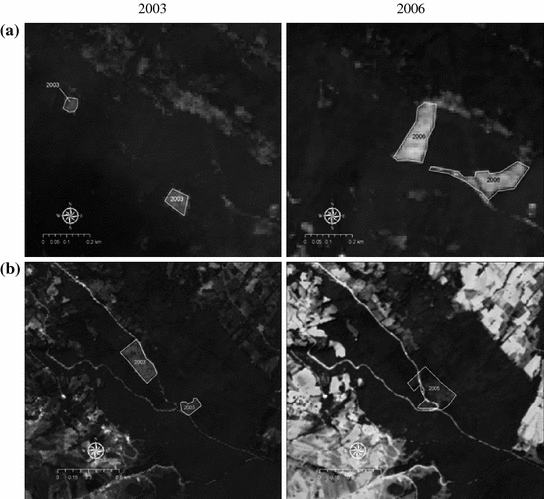
The results demonstrated that mapping and dating forest clearcuts is possible and feasible if post-cut images are available within a timeframe of 1 or 2 years since the cut (Fig. 7.3).


Fig. 7.3
Examples of comparison of SPOT5 HRG infrared images from different years evidencing clearcut areas (white delineated polygons with the clearcut year). The images were acquired in late spring or summer of 2003 and 2006. Both cases a and b are from Regione Molise (from Chirici et al. 2011 modified)
The comparison between the in-field validated satellite-based map with over 9,500 clearcuts and aggregated official statistics demonstrated a significant underestimation by the latter (65 % of the total mapped clearcut area).
The object-oriented approach resulted in better results confirming the findings of Desclée et al. (2006). An operative probabilistic procedure based on VHR (very high resolution) satellite samples was proposed by the authors to correct official harvesting statistics.
7.2.3 Carbon Loss Due to Harvesting
According to Papale et al. (2005), the losses of carbon (Cwood utilization) from forests due to forest harvesting can be assessed as follows:
![$$ C_{wood\;utilization} = HV \cdot k_{1} \cdot bd \cdot k_{2} \left[ {\text{t}} \right] $$](/wp-content/uploads/2015/10/A304823_1_En_7_Chapter_Equ1.gif)
where
![$$ C_{wood\;utilization} = HV \cdot k_{1} \cdot bd \cdot k_{2} \left[ {\text{t}} \right] $$](/wp-content/uploads/2015/10/A304823_1_En_7_Chapter_Equ1.gif)
(7.1)
HV = harvested wood volume [m3];
k1 = average expansion coefficient to take into account the wood residuals left in the forest stands (cutting woody debris); this coefficient was set equal to 1.176, according to Corona and Nocentini (2002);
bd = average wood basal density of forest tree species in Italy, set equal to 0.65 t m−3, according to APAT (2003);
k2 = average carbon content per unit of wood biomass of forest tree species [t t−1], set equal to 0.5 according to APAT (2003).
According to ISTAT, 54 % of annual harvested volume is represented by coppice forests, corresponding to 4.26 × 10⁶ m3. Thus wood removals through clear cuts in Italy officially represent an annual loss of carbon of about 6 Mt CO2.
As a conclusion, on the basis of the underestimation of official statistics on clear cuts harvesting presented above, it can be hypothesized an underestimation on carbon losses at national level of about 2 Mt CO2.
7.3 Wood Products
After forest harvesting, wood products continue to store carbon for a certain time, from some weeks for paper to many years for timber beam used in construction. At the end of their life cycle, wood products can be recycled, stored in landfills or used for generating energy, thus substituting fossil fuels. At the same time various types of carbon storage and new raw material are provided by forests for industrial purposes. After a highly variable period of time, wood products will release carbon back to the atmosphere through emissions from production processes and decay of wood-based products (Eggers 2002). Research on this topic is still novel and a substantial effort was given in the framework of Cost Action E31 “Management of Recovered Wood” to reduce the uncertainties in determining the lifespan of wood material after harvesting.
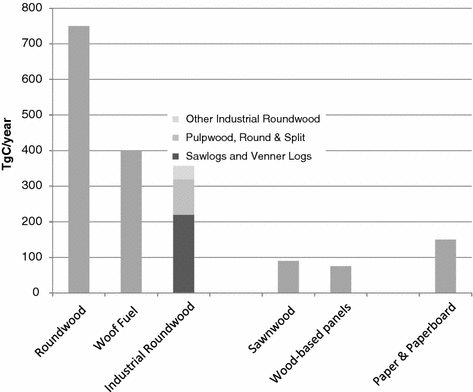
Carbon is stocked in wood and paper products in use and in landfills. The global pool of carbon stored in forests products is estimated to be growing (Fig. 7.4), from 2007, by 150 Mt C (540 Mt CO2 equivalent) per year (Miner and Perez-Garcia 2007) reaching 5 Gt C (18.3 Gt CO2 equivalent) in 2010. For this reason wood and paper products may potentially play an important role in mitigating carbon emissions in the atmosphere. This topic was investigated in several studies. Skog et al. (2000) used historical data and long-range projections in order to track roundwood and carbon disposition through to end uses such as housing and paper. Miner and Perez-Garcia (2007) examine the significance of emissions, sequestration and avoided emissions of various wood products in order to assess the carbon profile of the forest product industry.


Fig. 7.4
Estimated C fluxes in global production of harvested wood products in 2003 (based on FAO STAT 2005)
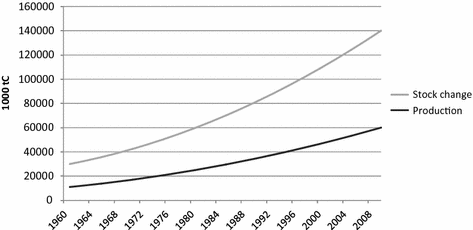
Some studies assess carbon sequestration for a range of hypothetical conditions of forest growth, harvest, end use, and discarding (Schlamadinger and Marland 1996). A worldwide study by Winjum et al. (1998) estimates net flows of carbon out of forests and into products by using two accounting frameworks—the stock change method, and the atmospheric flow method. They use simplified assumptions to make estimates of net stock changes and net emissions to the atmosphere by world regions.
The highly variable duration of carbon stock in wood products depends on their composition, their level of production-consumption and their average life cycle, an extremely variable parameter (from few months for newsprint to many decades for laminated beam).
7.3.1 Carbon Accounting Scheme for Wood Products in Italy
The question on how to account emissions or stock-changes for HWP in the context of the UNFCCC has been extensively discussed and assessed internationally. Different approaches have been proposed and they differ in how they allocate emissions between wood producing and consuming countries, and in what processes they focus on (Brown et al. 1998; Winjum et al. 1998; Lim et al. 1999).
In a study performed by Kloehn and Ciccarese (2005) the three approaches proposed by IPCC (2003) were applied in order to estimate GHG balances in wood products in Italy: production approach, stock change approach and atmospheric flow approach (Nabuurs et al. 2003; Pingoud et al. 2006).