Afforestation and Reforestation: The Sicilian Case Study

Fig. 12.1
Location of the study sites (black circles) within the three most widespread bioclimatic belts (sensu Rivas-Martínez) of Sicily: light grey thermo-mediterranean, medium grey meso-mediterranean, dark grey supra-mediterranean. Dashed other bioclimates; climatic data issue from Drago et al. (2002)
12.2.1 Original Sampling Data
Soil sampling was carried out in sites where series of secondary succession, i.e. different progressive successional stages, were present. Throughout all bioclimates, we defined as successional stages the following six land use classes: (1) CU = cultivated areas (orchards, cereal crops); (2) HE = herb-dominated plant communities without presence of woody species (grazed pastures, old fields abandoned by agriculture since a few years); (3) PG = grasslands dominated by perennial grasses; (4) GS = garrigues and low shrublands; (5) MA = maquis; (6) FO = natural forests. In every bioclimate the most representative succession pathways were chosen, for each site, except for supra-mediterranean belt, where the successional stages 3 (PG) and 5 (MA) are missing.
In addition to the soil samples taken in different successional stages, also samples in nearby artificially afforested sites (AF) were analyzed. All sampled afforested sites were Pine plantations, wherein the dominant Pine species depended on the bioclimatic belt (Pinus halepensis Mill. and Pinus pinea L. in the thermo- and meso-mediterranean belt, Pinus nigra J.F. Arnold in the supra-mediterranean bioclimate).
Soil was sampled according to the protocol of the Italian National Inventory of Forests and Forest Carbon pools (Gasparini et al. 2008). After litter removal, mineral soil samples were collected at depths of 0–10 and 10–30 cm, using a 340 and a 680-cm3 cylinder, respectively. For every site and succession stage/afforestation, three replicates of both soil depths were taken, respectively.
The soil samples were gently broken, passed through a 2-mm sieve, air dried, treated with HCl 2:1 to remove carbonates and then analysed for C content using a CHN-Elemental Analyzer. SOC content was first expressed as a percentage (g of C per 100 g of dry soil × 100) and then converted to tons per hectare based on bulk density (BD) and soil depth. Bulk density was measured based on the volume of the collected sample and the weight of dry soil in the sample (Blake and Hartge 1986). Mass correction of SOC stock estimates based on BD is crucial for estimating the effects of land-use change because land-use change is always accompanied by changes in BD. All data were adjusted to 30 cm depth.
12.2.2 Data from Literature
Existing literature including SOC analyses in Sicilian sites was screened for data taken in successional stages or in land use classes, which could be compared, as similar to stages of secondary succession. Moreover, SOC data of afforested areas (Pinus spp., Eucalyptus spp.) in proximity to the successional areas were included in the analyses (Ballatore and Fierotti 1970; Raimondi et al. 1983; Panno et al. 1986; Ferro et al. 2008; Agnese et al. 2011; Novara et al. 2012; La Mantia et al. 2013).
12.2.3 Data Analysis
For data analyses, average SOC stock values were computed from sites and replicated for each succession stage and for afforested sites within the three bioclimatic groups.
Furthermore, in order to confront SOC among succession stages within each bioclimate, an average index of SOC content change has been used:
Succession Carbon Change Index
 where Colder = SOC content in the older successional stage, and Cyounger = SOC content in the younger successional stage. A positive value indicates a gain in carbon stock from a younger succession stage to an older stage, while a negative value indicates a loss in carbon stock.

In order to evaluate for each bioclimate the effect of artificial afforestation in comparison with a considered stage of succession, another average carbon change index has been used as follows:
Afforestation Carbon Change Index
 where Cafforestation = SOC content in the afforestation, and Csuccession stage = SOC content in the succession stage. A positive value indicates a gain in carbon stock by afforestation activities in confront with the respective succession stage, while a negative value indicates a loss.

Lastly, the C stock data have been used to calculate the total C gain in areas subject to secondary succession in the region of Sicily between the years 1990 and 2006. Surface data of agricultural abandonment and areas subject to secondary succession processes were elaborated from CORINE land cover classification data.
12.3 Results
12.3.1 SOC Variation in Natural Afforestation
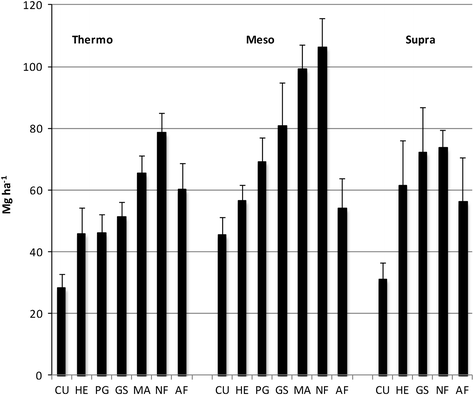
In all bioclimates, SOC stock increased more than twice from cultivation to the last stage of succession (Fig. 12.2). A noteworthy difference in SOC stock between the bioclimates has been observed: from cultivated soils to forest soils, SOC stock increased from 28.31 to 78.60 Mg ha−1 in the thermo-mediterranean bioclimate, from 45.51 to 106.29 Mg ha−1 in the meso-mediterranean bioclimate and from 31.25 to 73.70 Mg ha−1 in the supra-mediterranean bioclimate.


Fig. 12.2
SOC stock (Mg ha−1) in the various stages of secondary succession and in the afforested sites and in three bioclimates (0–30 cm soil depth). Abbreviations: CU cultivated areas, HE herb-dominated plant communities, PG perennial grasslands, GS garrigues and low shrublands, MA maquis, NF natural forests, AF artificial afforestations; Thermo thermo-mediterranean, Meso meso-mediterranean, Supra supra-mediterranean bioclimate
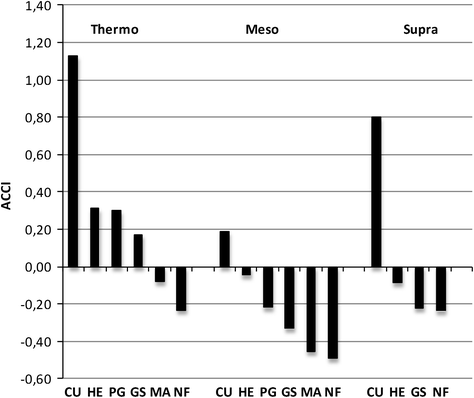
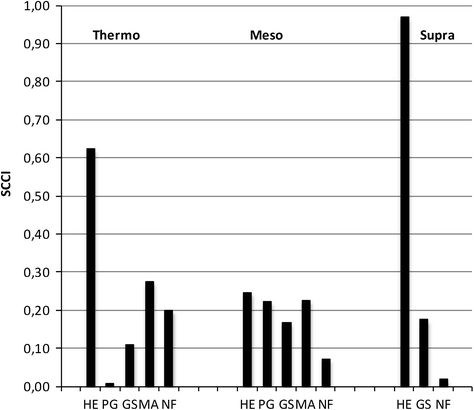
Furthermore, in all bioclimates SOC stock increased from one succession stage to the next one (Fig. 12.3). In the thermo-mediterranean belt, there was a high increase in SOC from the cultivated soils to the soils under herb-dominated plant communities. So, the cessation of soil tillage or chemical weed control after cultivation abandonment seems to be an important factor for SOC accumulation.


Fig. 12.3
Succession Carbon Change Index (SCCI) in the three bioclimates, indicating SOC stock variation between the various stages of secondary succession. Abbreviations: CU cultivated areas, HE herb-dominated plant communities, PG perennial grasslands, GS garrigues and low shrublands, MA maquis, NF natural forests, AF artificial afforestations; Thermo thermo-mediterranean, Meso meso-mediterranean, Supra supra-mediterranean bioclimate
On the contrary, we observed only a low SOC stock increase from herb-dominated plant communities to perennial grasslands, and SOC gain during the woody-dominated stages of succession assumed intermediate values.
In the meso-mediterranean bioclimate, relative SOC stock increase with cultivation abandonment, i.e. from cultivated soils to herb-dominated soils, is only half as much as in the thermo-mediterranean belt. On the other hand, there was a higher increase from herb communities to perennial grasslands. SOC gain in the older succession stages was similar to the thermo-mediterranean belt.