5 Data Analytical Tests
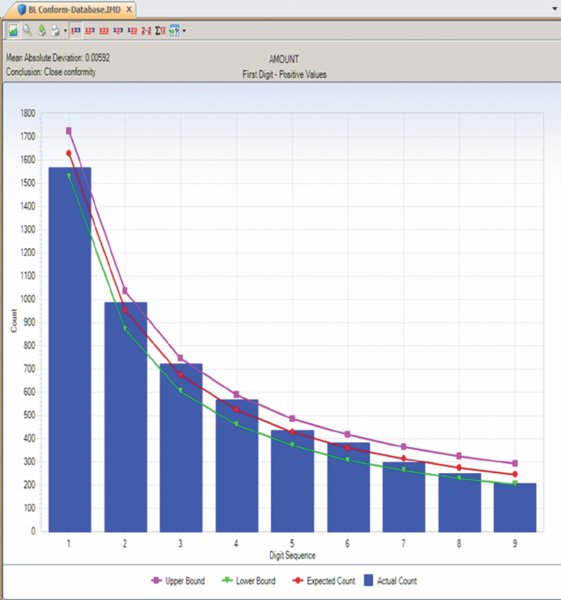
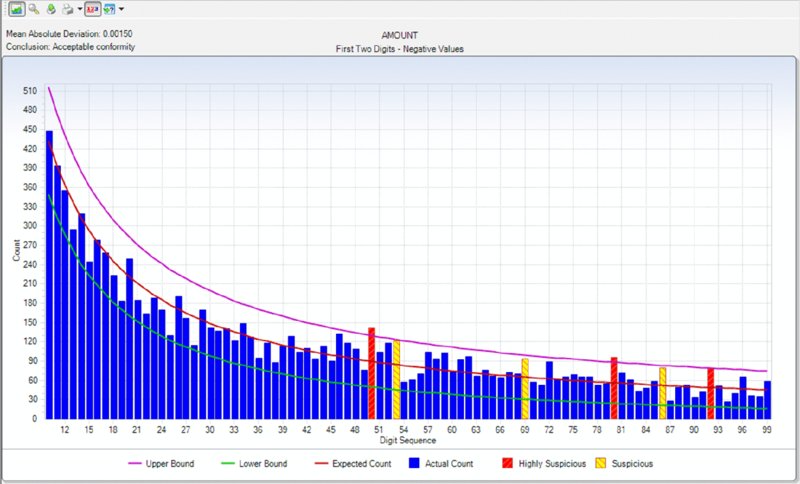
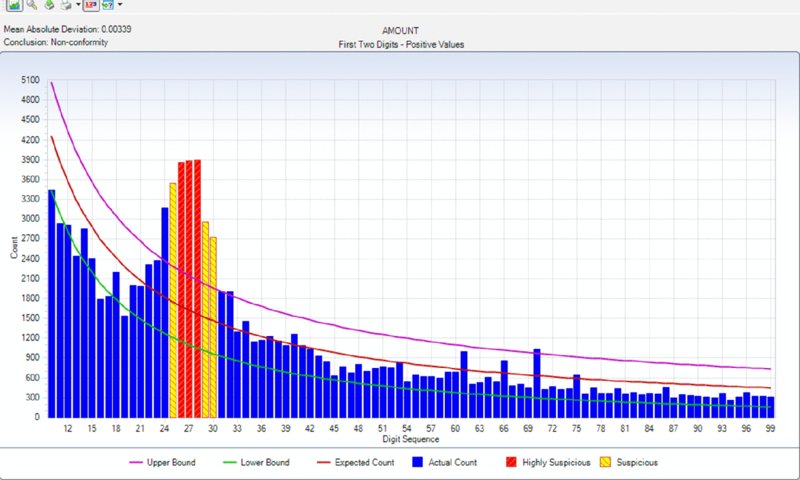
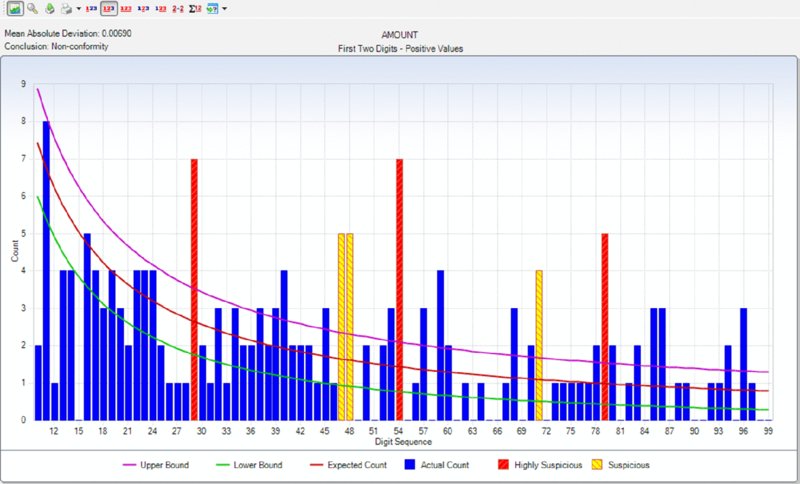
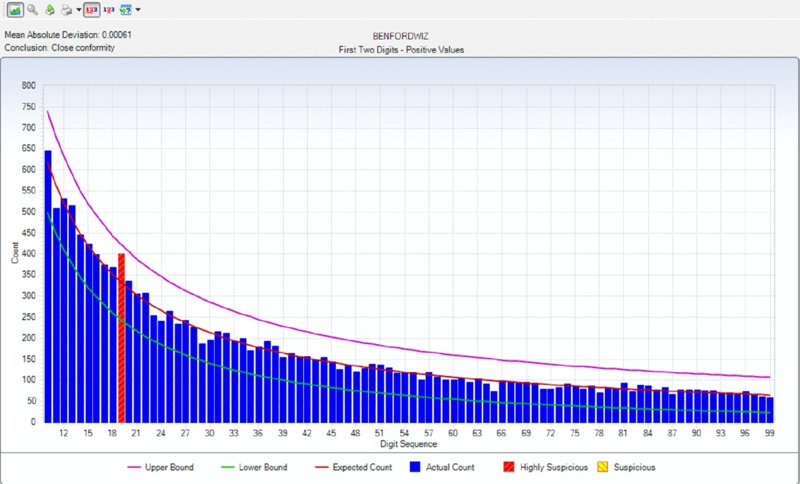
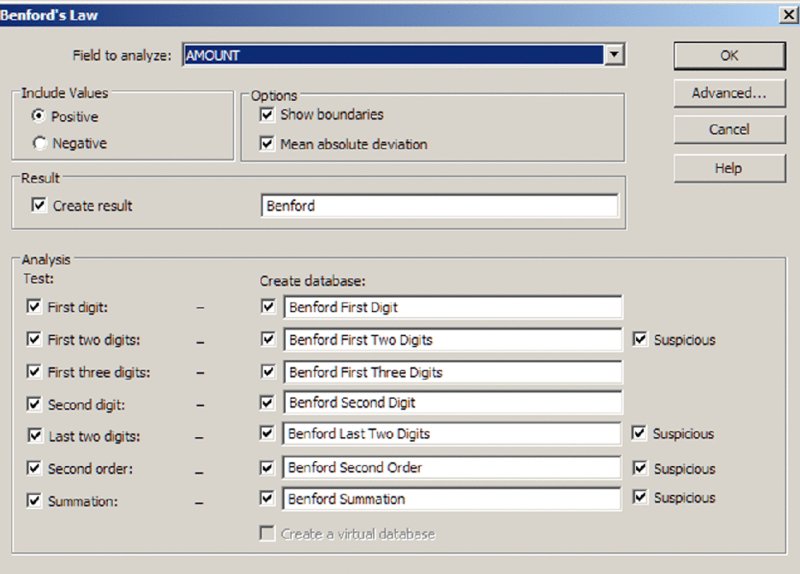
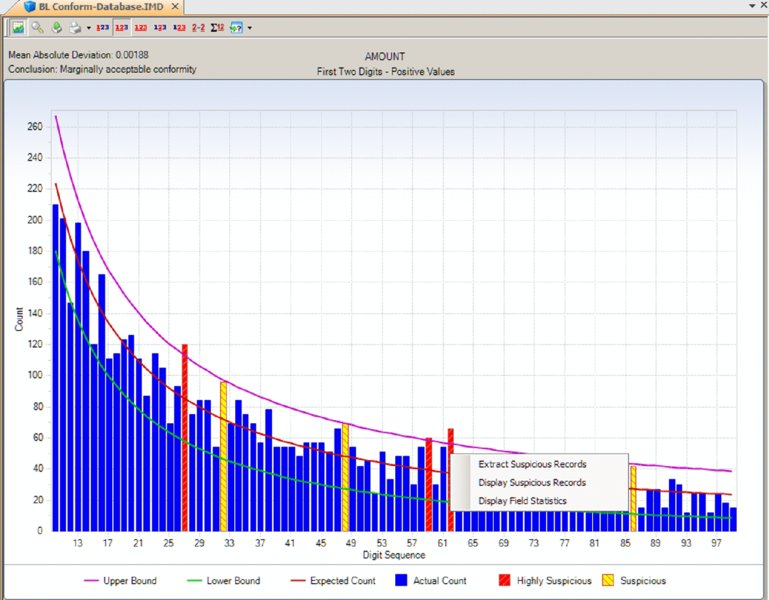
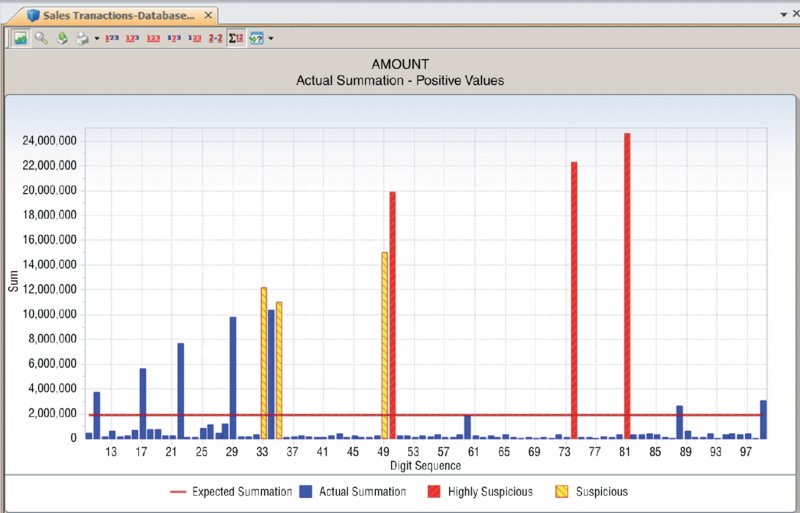
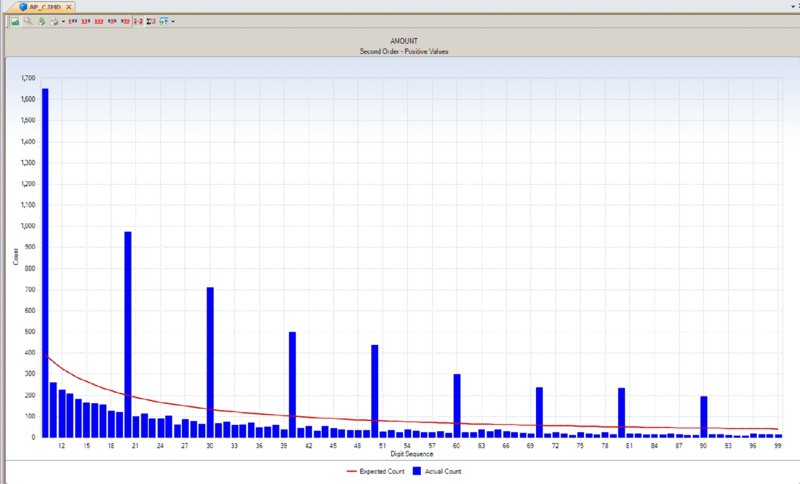
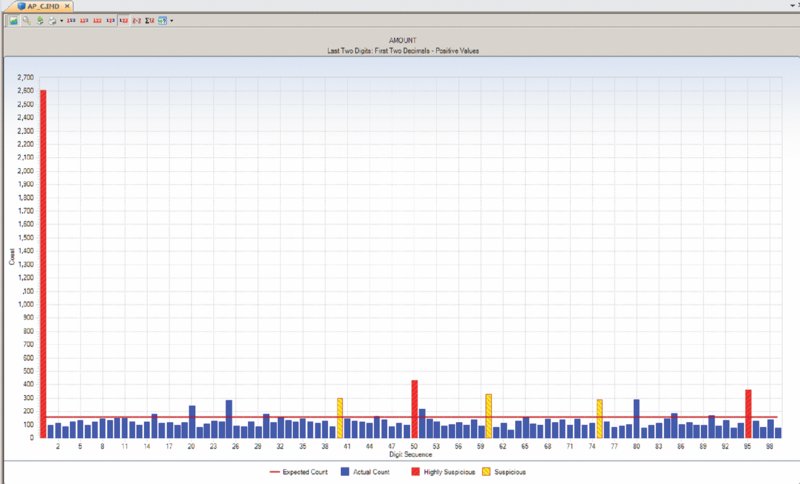
CHAPTER 5 DATA ANALYSIS USES TECHNOLOGY to detect anomalies, patterns, and risk indicators within the data set. It can be used to establish a hypothesis or to quantify detected issues if the hypothesis was found to correctly identify fraud. The true power of data analytics is that the entire data set of the transactions can be tested. Unlike sampling where only a part of the population is tested, data analytics can test 100 percent of the transactions. Resulting anomalies can then all be reviewed or, if in large quantities, sampled. While the analysis can provide a list of anomalies, it is not a list of fraudulent transactions. Unlike statistical sampling, there is no mathematical formula that provides the auditor with a listing of frauds. The auditor needs to apply professional judgment, employ analytical skills, and use intuition. Typically, the auditor reviews the list of anomalies, audits some of the transactions, revises the hypothesis, adjusts the test, and performs additional analytical procedures to refine the list to reduce false-positive transactions. There will be numerous false positives of true data anomalies that are not fraud. This is a product of data analytics. The circular process may continue several times. When completed, the test identifies transactions with a high risk of fraud. This manageable number of transactions can then be examined using fraud-audit procedures. Once a single fraudulent transaction is detected, the audit plan should be revised to expand the review and investigation. Once the auditor is familiar with the data, the business systems, and the business environment, a number of general analytical tests can be applied against the entire data set or to a specific category or class of transactions. General data analytical tests are those that can and should be applied against the entire data set to provide the auditor or investigator with a starting point for further audit or review. The general tests output transactions that are outliers, anomalies, or suspicious items. The tests can go through 100 percent of the transactions looking for the defined anomalies. It reduces potentially millions of transactions to a reasonable number to review. The tests may also reveal patterns of interest about what should not be there or should be there. General tests show the power of data analytics. It allows the auditor to perform much more than sampling and allows them to test hypothesis and potential fraud scenarios. Being able to examine transactions at the source level assures the auditor of the integrity of the information. It allows the auditor to obtain insights to potential indicators of fraud and to the effectiveness of internal controls. Often, small anomalies are missed but it is these small anomalies that indicate weaknesses in internal controls that can be exploited. Data analytics of transactional data is a proactive approach in detecting fraud. “The Benford’s Law–based tests signal abnormal duplications. The mathematics of Benford’s Law gives us the expected or the normal duplications, and duplications above the norm are abnormal or excessive.”1 Benford’s Law forms part of many audit plans and is frequently used by auditors. However, it is not always well understood. The results of applying Benford’s Law provide a starting point for the auditor. Benford’s Law analyzes the digits in numerical data, helps identifies anomalies, and detects systematic manipulation of data (that is, the making up of false numbers) based on the digital distribution in a natural population. Natural population could be almost anything, such as all the transactions in a general ledger, the transactions in accounts payable, or even the cubic meters of water in all the lakes in Africa. Frank Benford published “The Law of Anomalous Numbers” in 1938; it postulated that the lower the leading digit of a number, the more often it would appear. Frank Benford used data from rivers, populations, newspapers, cost data, addresses, and many other categories to confirm his theory. Since then, many have furthered his research, particularly Mark J. Nigrini, PhD. He has written many articles and books on the subject, such as Benford’s Law: Applications for Forensic Accounting, Auditing, and Fraud Detection. In 1938, the research and calculations were performed manually, which was painstaking. Today, with computing power and the ease of accessing big data sets, one can see that Benford’s Law of expected numbers is valid. One website (http://TestingBenfordsLaw.com) applies a number of data sets against Benford’s Law. It tests data such as Twitter users by followers’ count, most common iPhone passcodes, population of Spanish cities, U.K. government spending, and even includes the first 652,066 Fibonacci numbers. The expected values for any data set of the first leading digit and also for the first two leading digits are outlined in Table 5.1. Table 5.1 Benford’s Law First Digit Frequency and First Two Digits Frequency For the first digit test, the first leading digit output is depicted in the graph in Figure 5.1. For example, the leading digit 1 appears 30 percent of the time, whereas the leading digit 9 appears 4.6 percent of the time. The bars are the actual data counts and the lines are the lower and upper boundaries along with the expected count. This data set conforms to Benford’s Law. Figure 5.1 Benford’s Law First Digit Test For Benford’s Law to be applicable, certain conditions must be met. Primary Benford’s Law tests are the first digit, first two digits, first three digits, and second digit tests. Advanced Benford’s Law tests are summation and second order. Associated tests are last two digits, number duplication, and distortion factor model. All but the last two tests can be automatically executed from within the IDEA software. The number duplication test identifies specific numbers causing spikes or anomalies in primary and summation tests. Spikes in the primary tests are caused by some specific numbers occurring abnormally too often. Abnormally large numbers in value cause spikes in the summation test. The distortion factor model shows whether the data has an excess of lower digits or higher digits. It assumes that the true number is changed to a false number in the same range or percentage as the true number. Most presentations and articles discuss using Benford’s Law to detect numbers near their authorization limits. For example, if someone’s authorization limit is $10,000, then many first two digits in the 99, 98, and 97 area will be detected using Benford’s Law if they are trying to maximize authorizing expenditures. Some other practical applications include: There is a potential to detect money laundering because money laundering flows money into the revenue stream that is not generated by the regular business. Since paying income tax on the false revenue is not desirable, corresponding expenses are made up to offset the false revenue. If there are enough of these made-up expenses or numbers, Benford’s Law may detect the anomalies. Not only is Benford’s Law relevant to detecting anomalies in financial related data, it is applicable in other fields, too. A study was published in the New Zealand Journal of Marine and Freshwater Research entitled “Statistical Fraud Detection in a Commercial Lobster Fishery.”2 The study tested the reliability of fisheries’ data in Canada. The study was prompted by the fact that lobster sales formed a large part of the underground economy. The Royal Canadian Mounted Police proceeds-of-crime unit first thought that large money transfers into a bank branch was from drug money, but later found them to be from cash sales of lobster. From highly regulated lobster fishery areas, the data was found to conform with the distribution as expected by Benford’s Law. Lobster and snow-crab data from different, less regulated areas did not conform. Another research paper titled “Not the First Digit! Using Benford’s Law to Detect Fraudulent Scientific Data,”3 found that there could be nonconformity with Benford’s Law for the second or higher order tests for scientific data produced by researchers. Fabricated data may conform to the first digit test. The paper “When Does the Second-Digit Benford’s Law-Test Signal an Election Fraud? Facts or Misleading Test Results”4 focused on Benford’s Law and the conformity or nonconformity of election results. The first digit test is a high-level test and is suitable for use with less than 300 transactions. The first three digits test is too detailed and will result in the need to investigate too many anomalies. The first two digits test is the most practical to use. Examples of applying the first two digits test are shown in Figures 5.2, 5.3, 5.4, and 5.5. Figure 5.2 Benford’s Law First Two Digit Test Accounts Payable from a Large Corporation Example Showing Conformity to Benford’s Law Figure 5.3 Benford’s Law First Two Digits Test Accounts Receivable File of an Automotive Manufacturer Showing Nonconformity Spikes Figure 5.4 Sample Payment File Included with the IDEA Software Showing Nonconformity to the First Two Digits of Benford’s Law Figure 5.5 Benford’s Law First Two Digits Test on Data Generated with Benfordwiz Software Showing General Conformity There are significant spikes for the first two digits of 19, 20, 21, . . . 31 and 32 in Figure 5.3. As this is an auto manufacturer, they sell cars to dealerships where sales of $19,000 to $32,000 are normal. Knowledge of the business allows you to eliminate this area for additional review. Figure 5.4 clearly shows that Benford’s Law identified the contents of this file as fabricated to be used to demonstrate payment data with the IDEA software. The author generated the data in Figure 5.5 using the BenfordWiz software download from www.members.tripod.com/benfordwiz. This is to demonstrate and make auditors aware that where there are tools to detect fraud, there are always tools developed to prevent or circumvent detection. The Benford’s Law feature in IDEA can provide a valuable reasonableness test for large data sets. The positive and negative numbers are evaluated on their own due to the fact that positive numbers behave very differently from negative numbers. For example, where positive earnings are manipulated for management bonuses, there is motivation to increase the earnings, moving away from zero toward larger numbers. Where there are losses and management wishes to improve stock prices, there is incentive to move the larger negative number to a smaller one toward zero. IDEA can apply most of the Benford’s Law tests and can also display suspicious results in graphical format. Tests provided in IDEA are the first digit, first two digit, first three digits, second digit, last two digits, second order, and summation tests as shown in Figure 5.6. Figure 5.6 Applying the Benford’s Law Feature in IDEA Results that show a poor fit with Benford’s Law should be examined, as they are an indicator of excessive duplications and anomalies. This first two digits primary test output from IDEA indicates that it marginally conforms in Figure 5.7. The graph highlights the three most highly suspicious numbers and the three most suspicious items. By placing the cursor over any bar, such as the highly suspicious 62 bar, options for extracting or displaying the records are offered. Field statistics may also be displayed. Figure 5.7 First Two Digits Test Benford’s Law Output with Suspicious Numbers Highlighted The summation test (Figure 5.8) analyzes the first two digits in the data by grouping the records of the first two digits together and then computing the sum of each group. Amounts with the same first two digits, such as 1200, 125, 12, 1234, and so on, are added together. Using the computed and summed values, the process determines whether a uniform distribution is followed. The summation test identifies excessively large numbers as compared to the rest of the data. The test is based on sums rather than on counts, as in the other Benford’s Law tests. In theory, the sums of numbers with the same first two digits should be equal in distribution. However, in normal data sets, there are regular abnormal duplications of large numbers that may be caused by a few very large numbers or a high volume of moderately large numbers. Additional analysis will be needed. Figure 5.8 Benford’s Law Summation Test Example The second order test is also based on the first two digits in the data. The data is sorted from the smallest to the largest and the differences between each pair of consecutive records are checked to determine whether they conform to the expectations of the first two digit distribution. Numbers of even tens—10, 20, 30, 40, 50, 60, 70, 80, and 90—on their own are expected to conform to the Benford’s Law distribution and the rest of the numbers on their own are also expected to conform, as displayed in Figure 5.9. Figure 5.9 Benford’s Law Second Order Test Example The last two digits test groups the last two digits and computes the frequency. The grouped frequency is matched against the expected uniform distribution. In the accounts payable file shown in Figure 5.10, numbers ending in .00 significantly exceed the expected distribution but were found to be normal based on their actual payments. Usage Considerations of Benford’s Law Figure 5.10 Benford’s Law Last Two Digits Test Example For effective usage, amounts of less than $10.00 should be removed from the data. IDEA automatically does this task before performing the Benford’s Law calculations. The auditor must bear in mind that there are costs associated with false positives (identifying a fraud condition when none is present) as well as with false negatives (failing to identify a fraud condition when one exists). The auditor must consider the level of significance to select for further investigation. A balance must be found so one does not investigate too many or too few transactions. Are there categories of fraud that cannot be detected? As Benford’s Law detects excessive duplications or made-up numbers, it is not appropriate for detecting deletions. If transactions were randomly deleted from sales, say from a point-of-sales system, the randomness would ensure that there would be no variation from the expected distribution of the original data set prior to any deletions. Conclusion Benford’s Law is a wonderful tool for initial risk assessment of the contents of a data set. It provides the auditor or investigator with a good starting point. The user must understand the business and the industry to effectively use this tool. Knowledge of the business can quickly eliminate false positives, such as in the example of the automotive manufacturer where sales of cars to dealerships caused spikes for the first two digits in the 18-to-32-digits range, as displayed in Figure 5.3.
Data Analytical Tests
 BENFORD’S LAW
First Digit Frequency
Second Digit Frequency
0
—
0.11968
1
0.30103
0.11389
2
0.17609
0.10882
3
0.12494
0.10433
4
0.09691
0.10031
5
0.07918
0.09668
6
0.06695
0.09337
7
0.05799
0.09035
8
0.05115
0.08757
9
0.04576
0.08500
Using Benford’s Law in IDEA
 NUMBER DUPLICATION TEST