16 Zapper Fraud
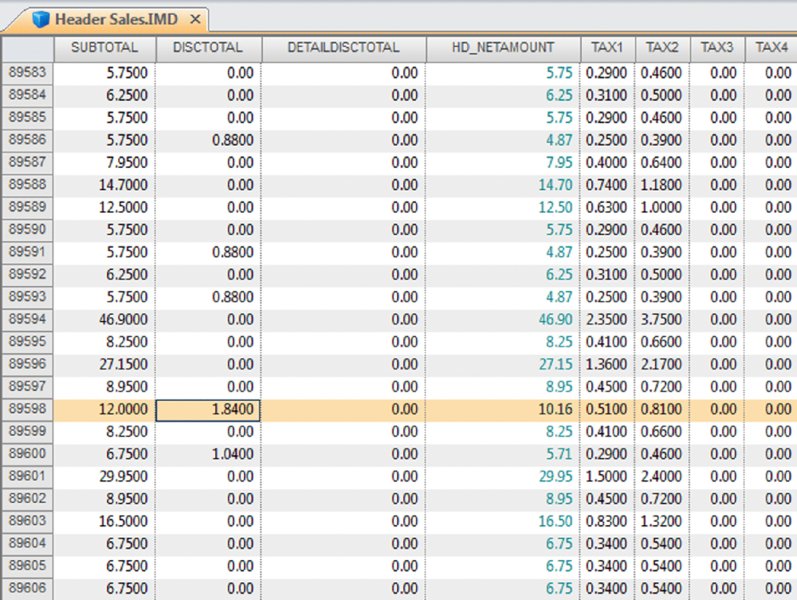
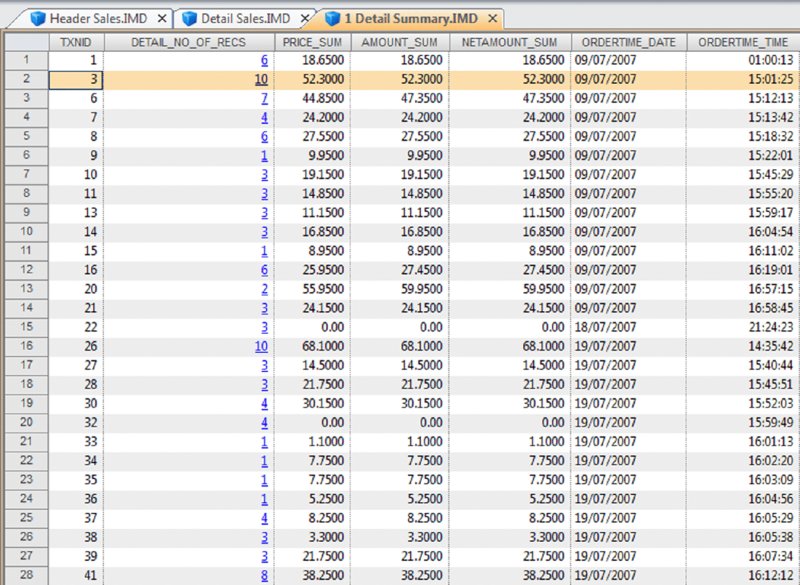
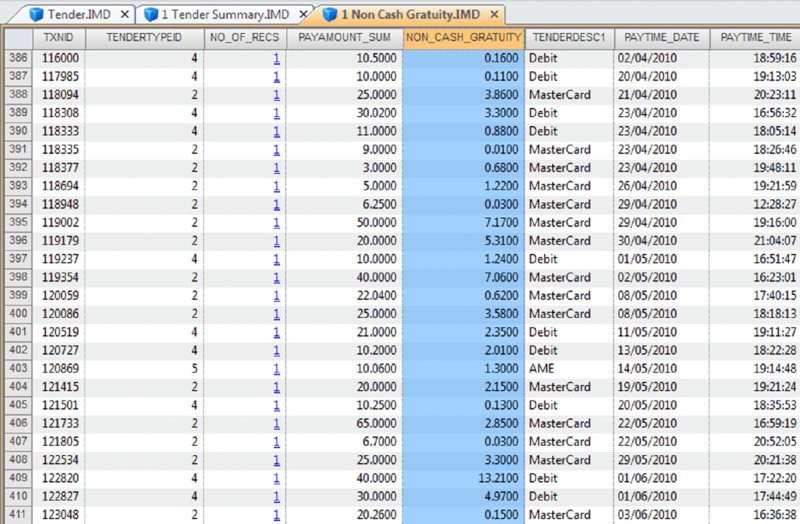
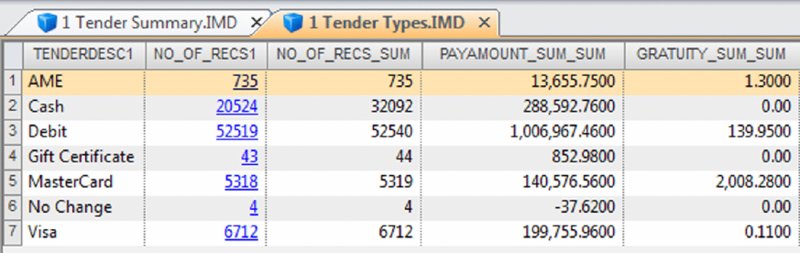
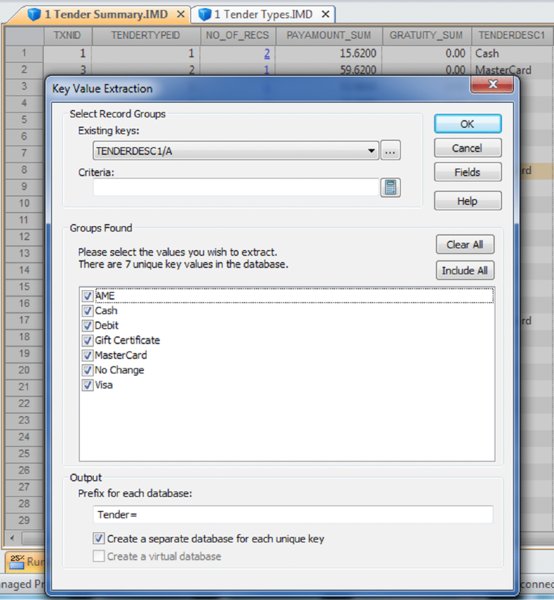
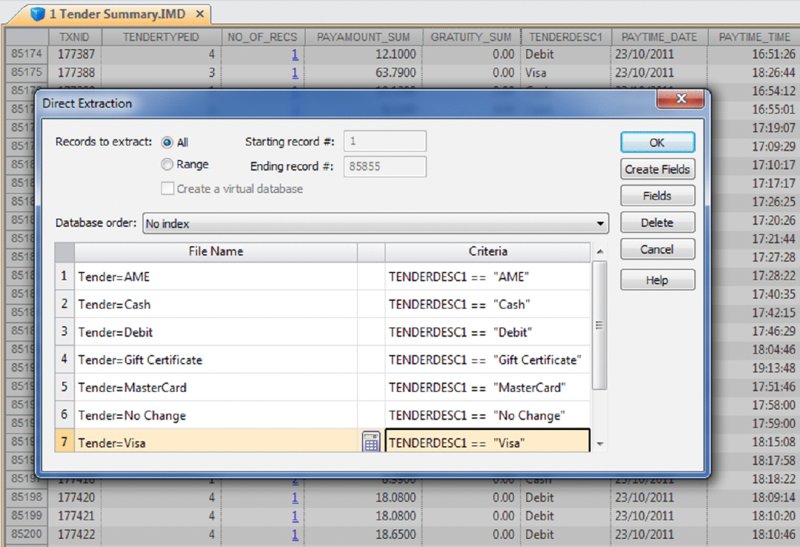
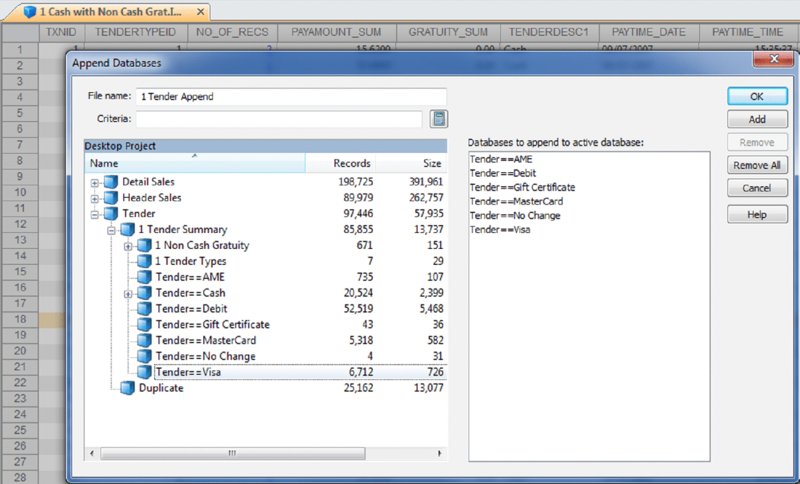
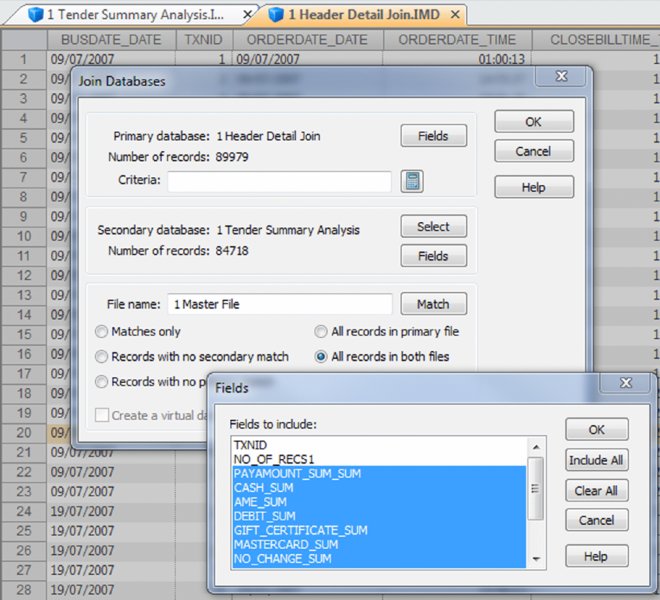
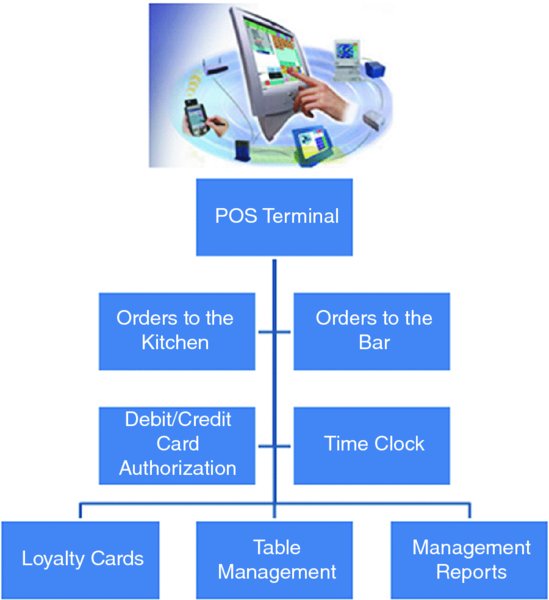
CHAPTER 16 THE BASIC CASH REGISTER has evolved into electronic cash registers and now to computerized point-of-sale (POS) systems. Point-of-sale systems are typically attached to a computer that may include a cash drawer, receipt printer, and a credit or debit card terminal. Many systems have touch screens to simplify information entry and may have a barcode scanner or even be complemented with a radio frequency identification (RFID) reader. Weighing scales may also be attached for use in certain types of stores, such as grocery stores. POS systems can integrate with accounting modules and inventory systems. If the inventory module is utilized, the business’ inventory control is the POS system. Since sales are recorded in real time, inventory records are immediately updated. POS systems provide a wealth of information relevant to operating the business efficiently. Sales data can be analyzed so that inventory replacement and levels can be adjusted accordingly. Sales histories can provide trends to influence purchasing decisions. Accuracy is significantly improved with the POS system, in terms of charging correct sale prices and related payments by customers. Cash received from customers is better controlled to prevent theft as POS systems provide information and audit trails to trace or isolate any problems. Traditionally, retailers and those in the hospitality industry predominantly used POS systems. Today, you will find many industry-specific POS packages, including automotive maintenance shops, municipal community recreations, dry cleaners, spas, hairdressers, and more. POS systems provide many types of reports to the business. This is possible because the system captures and retains transaction-level, detailed records. As such, much data is available to the auditor for review. Not only do auditors need to be aware of the employee register-disbursement schemes discussed earlier, but they must also know about electronic suppression of sales techniques. Electronic suppression of sales is popularly known as zapper fraud, and those with high-level access to the POS system perpetrate it. They are normally the owner/shareholder of the business or a manager who runs the business on behalf of the owner. Zapper software is separate from the POS system created by the POS system-software developers or by third parties. These are external programs that can be executed from a DVD/CD or other removable media such as a USB key. Phantomware is software that is included with the POS system and built in. Normally, phantomware is not well documented in the POS user’s manual if it is documented at all. While zapper software’s main purpose is to delete sales, phantomware sometimes has the capability to perform maintenance functions on the POS data. What is the advantage of using a zapper? The POS system provides controls that make it difficult for staff to skim money from the business. The employees’ cash-out sheets reconcile with the till and POS-system information. The owner wishes to retain these controls and uses zapper software after the employees cash out. The zapper software is executed after the close of business either on a daily, weekly, monthly, or other periodic basis. Employees are never aware that the owner is skimming. Why would the owner skim from the business that he owns? The owner has many partners that have an interest in the business receipts. The government is a partner in terms of goods and services tax or value-added tax collected by the business on its behalf (GST/HST, VAT) and profits subject to income taxes. Another partner may be the landlord that bases rent partially on a percentage of sales. The business may be a franchisee that has to pay royalties to the franchisor. Finally, the business may have silent partners or investors that the managing partner is cheating on. It may be a combination of some or all of the mentioned situations. In that event, it would be extremely lucrative for the managing partner to delete sales and pocket the proceeds. Our discussion will focus on the hospitality sector, as restaurant POS systems are not normally linked to the inventory module, which makes the deletion of sales much harder to detect. The retail sector tends to have their products programmed into the POS system for ease of completing the sale at checkout. The inventory module is usually linked to the POS sales system. Even if the inventory module is not activated, the fact that the business has goods or inventory means these can be traced to sales. One possible exception may be grocery stores where there is much spoilage and the cost of goods is difficult to correlate to sales. There are hundreds of different types of POS systems available for the hospitality industry. They are normally networked and may have many stations. POS systems are effective for restaurants. As soon as the server makes an entry into the POS system, it immediately starts a process. The order could be sent to the terminal at the bar for drinks while food orders are sent to the kitchen for preparation. The POS has table-management capabilities in table assignments and tracks any table changes. Table changes may be in combining two tables or moving customers from a less desirable table to a better table. Food orders must be brought to the right table. Payments can be processed since debit and credit card terminals are linked wirelessly to the POS. Loyalty or VIP cards can be tracked and the applicable discounts be applied. The POS also acts as a time clock for hourly wages for servers when they log in and out of the system. The system can provide management with a host of reports to enable better decision making and restaurant management, as seen in Figure 16.1. Figure 16.1 Features of POS Systems The POS retains much detail data in order to be able to produce these reports. Therefore, data sets are available to the auditor for examination. The data sets are rich with information. Unless maintenance was done for the data, each transaction is appended to the database. Some data sets contain data from the first day the POS system was in operation. Typical database maintenance available in many systems would be to back up and archive the database and start a new database from a certain date on. This procedure reduces the size of a working or production database to make it more efficient by having less to process and save. Taxation authorities around the world are very concerned about the use of zappers to delete sales. They are the partners with the most to lose as sales tax, goods and service tax, or value-added tax are involved and the taxation of profits is in effect zapped. The Organisation for Economic Co-operation and Development (OECD) published a report titled “Electronic Sales Suppression: A Threat to Tax Revenues”1 in 2013. It can be obtained at www.oecd.org/ctp/crime/ElectronicSalesSuppression.pdf. The report states, “Tax administrations are losing billions of dollars/euros through unreported sales and income hidden by the use of these techniques. A Canadian restaurant association estimates sales suppression in Canadian restaurants at some CAD 2.4 billion in one year.” The report provided these international examples. The OECD report discusses undercover operations to target POS manufacturers. “Canada has used an undercover operation targeting a software developer where the officers posed as wealthy restaurant owners from abroad seeking to open restaurants in Vancouver. In the operation the undercover officers negotiated with a software developer for the purchase of a zapper and the evidence gained provided sufficient grounds for search warrants of the developers’ premises.”2 Printed news reporting of this undercover operation stated, “Zapper software manipulates and conceals the trail of sales transactions and renumbers the sales record, removing any gaps so that the tax crime is not detected by routine tax audits.”3 The news report suggests that zapper software is sophisticated and difficult to detect by routine audits. Court documents reveal, “Between October 2000 and August 2008, Mr. Au sold the Profitek system, along with the zapper program, to 23 known restaurant owners who have deleted cash sales for the purpose of evading income and sales taxes owing to the federal and provincial governments. The Canada Revenue Agency (‘CRA’) has completed audits for 14 of the 23 restaurants under investigation. The 14 audited restaurants suppressed a total of $14,000,000 in sales, which resulted in a loss of $2,400,000 in federal income tax and $1,000,000 in GST remittances.” The court document further described Mr. Au’s involvement in selling and supporting the zapper software. “Between May and August 2008, two RCMP officers, posing as new restaurant owners, negotiated the purchase of a Profitek system from Mr. Au. On June 16, 2008, one of the officers asked Mr. Au whether he could manipulate taxes with the POS system. Mr. Au replied that he had many satisfied Chinese customers and that cash transactions could be deleted using an additional program that cost $1,500. It was quick and easy to use and Mr. Au said he could install this program once the Profitek system was set up. Mr. Au assured the officers that they should not fear a government audit. Mr. Au said there was no danger of the government detecting the software on their computer; however, they had to keep the disc containing the software in a safe location. “Lastly, Mr. Au assured the officers that troubleshooting was part of the zapper service offered to customers.”4 So how does the Canada Revenue Agency detect the use of zappers? An internal report entitled “Electronic Suppression of Sales (ESS) Report on Phase One of CRA’s Strategy to Address ESS,” obtained under the Access to Information Act and Privacy Act, states the following. The best success in identifying zapper activity has come from in-depth analysis of the data produced by the POS systems. This has been accomplished by importing the raw databases into IDEA. IDEA allows flexibility to users with analyzing data. Unusual trends such as low cash sales and low average cash bills can be quickly identified using IDEA. In addition, by analyzing the raw databases, unusual and inconsistent information can sometimes be identified. With the assistance of data analytical software, the report estimated the amount of unreported sales to be over $71 million for the 76 cases involving potential ESS. At approximately $1 million per case, the stakes are very high. Using IDEA, we can analyze various anomalies in POS system data sets and also perform the trends as outlined in the report. Most POS systems are designed in the same general way somewhat to how many accounting systems are designed. All accounting software has a general ledger, a sales journal, and a disbursement journal. These are integrated internally when transactions are entered and processed. Similarly, POS Systems’ main data sets are the Header (Sales) file, the Detail Sales file, and the Tender (payment) file. They may have different file names in different POS systems. Basic analyses are done on the data from these three files. The three files can be analyzed separately, but better analysis can be done if the three files are combined as a master file. There are also many other files in the POS system that can be analyzed and compared to the master file to detect anomalies. To internally integrate the separate files in the POS, a unique transaction or reference number is necessary for the software to operate. Some systems use this unique transaction identification number as the bill number printed on the check or bill given to the customer. Most systems do not use a unique internal number as the bill number because the internal numbers may be sequential. Printing out that number on the bills would give competitors knowledge of the volume of business that the restaurant has. Other methods are used on the printed bills, including an automatic daily reset of bill numbers. In other words, the first bill of the day would always start at the number one. However, for the internal number, there is little reason for the POS system not to be in sequential order and to continue each day. This unique internal number is important in our analysis, as it is the match key or common key to join files together. For our case study, we will use data from a quick-service restaurant. A quick-service restaurant is also known as a fast-food restaurant. You have seen some of the data set as it was used in the Data Familiarization, Arranging and Organizing Data, Nonstatistical Sampling Methods, and the Z-score sections of the book. The steps outlined will not be identical for data sets from other POS systems, but the basic concepts can be used with any system. For example, you can use the two dBase files from the IDEA training course to perform some of the tests. The available fields are shown in Figure 12.1 in Chapter 12. Those files represent one location of a quick-service or fast-food hamburger chain and are named “ED-Sales-2010-L4.DBF” and “ED-Sales-2011-L4.DBF.” First, we need to create the master file and other files so that we can perform our analysis. We do this by using the “Header Sales,” “Detail Sales,” and the “Tender” files. The “Header Sales” file contains a single record for each sale or bill in the POS system. Some of the fields typically include a unique identifier (TXNID in this case), various data and time fields (order date/time, close of bill data/time, etc.), bill number, bill amounts, taxes, transaction status codes, and employee identification. The “Detail Sales” file contains multiple records or line items associated with each bill controlled by the unique identifier number. The date and time of the order, items ordered, quantity, price, and amount are included. Other fields that the “Detail Sales” file may have are bill reference number (references that are printed out on the hardcopy bills) and item-ordered categories. The “Tender” file is the payment file and is populated by the payment or tender method used by the customer to pay the bill. Tender methods include cash, various types of credit cards, debit cards, and gift cards. Also included are the unique transaction identifier number, payment date and time, tender type code, and payment amounts. Other fields that may be included are credit/debit card information, transaction status code, and employee identification. There are differences in the various POS systems but all POS systems have a relationship between the “Header Sales” file, the “Detail Sales” file, and the “Tender” file. Typically, as in our case, the total field in the Header file is equal to the summary or total of the payments in the tender file. The reason why we have to total the payments is that a single bill can be paid by more than one type of tender. For instance, a bill of $100.00 is paid by $20.00 cash and the balance of $80.00 by debit card. Sometimes when a number of customers split a bill, there may be a number of different types of tender payments to settle the bill that could include any combination of cash, Visa, American Express, gift certificates, debit cards, MasterCard, promotional coupons, and so on. The header subtotal field is equal to the total of the amounts by the unique transaction identifier from the detail file. Within the header file itself, the subtotal less discounts plus taxes is equal to the total. In our case, the tender file contains a field for gratuities or tips. Some POS systems or setups will use one of the multiple tax fields available to account for tips. Some systems cash out tips on credit or debit cards by applying the tip portion to the cash-tender field as a negative amount. For instance, a credit card payment of $40.00 contains a $5.00 gratuity. The full amount of $40.00 would be in the credit card tender field and –$5.00 is recorded in the cash-tender field. Gratuities have to be accounted for to ensure that they do not end up as sales in our analysis. When we are analyzing sales, we use the “Header” file, as the information is before taxes or taxes can be excluded. When we are analyzing the payments or tenders, we include taxes, as that is what was actually received by the restaurant. In our analysis to reconcile the sales data to the sales reports generated by the POS system, we should exclude all transactions other than those that were closed or completed. Typically, as in our case, the closed transactions are coded with the letter C in the STATUS field. Other status items, such as the letter V representing voids, should not be included as sales. Preparing the data files for analysis involves many steps that seem complex at times. This is especially true when you are performing the steps for the first time for POS systems you have not encountered before. By understanding the file-preparation steps in this case study, you can apply similar steps to other POS system data files. The objective is to end up with a good master file that you can use as the basis for your analysis. Step 1. Using the “Header Sales” file, we append a new field called HD_NETAMOUNT (short for header net amount), as shown in Figure 16.2. This field excludes discounts and taxes so the equation is: Figure 16.2 Creating a Net Amount Field Step 2. We summarize the “Detail Sales” file by the unique transaction identifier of TXNID and total the fields of PRICE, AMOUNT, and NETAMOUNT. Fields to include in the output file are ORDERTIME_DATE and ORDERTIME_TIME. Name this new file “1 Detail Summary.” This provides one TXNID from the details with a total for each of the PRICE, AMOUNT, and NETAMOUNT fields. All the separate line items have been rolled up and associated with the unique transaction identifier and we are working with totals per TXNID now. Step 3. Within the “1 Detail Summary” file, rename NO_OF_RECS to DETAIL_NO_OF_RECS as shown in Figure 16.3. This identifies that the number of records came from the “Detail Sales” file. The original line details can be displayed by clicking on any data content in the DETAIL_NO_OF_RECS field. For instance, there are 10 line items (menu items ordered) that are associated with TXNID number 3. By clicking on the number 10, which has an underscore, the 10 records will display. Figure 16.3 Summarized File with Renamed Field Step 4. Join the “Header Sales” file to “1 Detail Summary.” Designate the “Header Sales” file as the primary file and the “1 Detail Summary” file as the secondary file. Use TXNID as the Match Key Fields and select the “All records” in both files join option. Name this file “1 Header Detail Join.” We now have all the fields and information from both files together. Step 5. There are duplicate (25,162 records in this particular file) TXNIDs in the “Tender” file due to a payment and then a reduction due to discount, refund, and so on in the PAYAMOUNT field. Perform a summarization by TNXNID and TENDERTYPEID, and total on the PAYAMOUNT and GRATUITY fields using the “Tender” file. Fields to include in the output file are the TENDERDESC1, PAYTIME_DATE, and PAYTIME_TIME fields. Name the file “1 Tender Summary.” This will net out the negative amounts by totaling the PAYAMOUNT field. In addition, we total the GRATUITY field in case this amount is also adjusted. We output the TENDERDESC1, PAYTIME_DATE, and PAYTIME_TIME fields so these fields are available for future analysis. Step 6. Using the “1 Tender Summary” file, we need to extract all noncash gratuities if we are to perform various cash versus noncash types of analysis later. We perform a direct extraction using the equation of: Call this new file “1 Non Cash Gratuity.” @AllTrim function removes leading and trailing spaces from the TENDERDESC1 character field before comparing the field for < > (not equal) Cash. While the @Upper function converts the TENDERDESC1 field internally to uppercase, it is not necessary for this file. Both the @AllTrim and the @Upper functions were used here as safety measures in case of inconsistent entries. Step 7. In the “1 Non Cash Gratuity” file, change the field name from GRATUITY_SUM to NON_CASH_GRATUITY for us to identify that the field contains noncash gratuities. The results are shown in Figure 16.4. Figure 16.4 Noncash Gratuities Isolated Step 8. Using the “1 Non Cash Gratuity” file, summarize by the TXNID field and total on the PAYAMOUNT_SUM and the NON_CASH_GRATUITY fields. Call this file “1 Non Cash Grat Summary.” This is the continuation of the process to isolate and distinguish cash and noncash items. Step 9. Perform a summarization on the “1 Tender Summary” file by using TENDERDESC1 as the field to summarize and use the Numeric fields to total option on the fields NO_OF_RECS, PAYAMOUNT_SUM, and GRATUITY_SUM. Call this new file “1 Tender Types.” This provides us with a total of the number of transactions, amounts paid, and gratuities for each tender type as displayed n Figure 16.5. Figure 16.5 Payment Tender Types Step 10. Using the “1 Tender Summary” file, extract from the TENDERDESC1 field each of the seven tender types—AME (American Express), cash, debit, gift certificate, MasterCard, no change, and Visa. This is done by using the Key Value Extraction option or by Direct Extraction using multiple extractions. An example of both methods is displayed in Figures 16.6 and 16.7 for comparison purposes. Figure 16.6 Key Value Extraction of Tender Types Figure 16.7 Direct Extractions of Each Tender Type A Key Value Extraction is simpler to perform since much less typing is involved. You merely have to select the record groups in the existing keys menu. If the keys do not exist, click on the “. . .” button and then select the field to define the key. In the Groups Found box, all the unique keys are presented to you. They are checked by default and you can uncheck any of those that you do not need to extract into a separate database. In our case, we will leave them all selected as each tender type is needed. In the Output box, the Prefix for each database field is entered as “Tender=.” Each file created will commence with that file name. For example, the cash database will be named by IDEA as “Tender= =Cash.” If in the prefix, you merely enter Tender, the output file name would be “Tender = Cash.” Note that IDEA’s = = (or double equal) means an exact match of the whole word(s). The single equal = returns the text entered and any words beginning with that text. An equation of fieldname = “Cash” will return the contents of cash, cashier, cashiers, cashmere, and so on in that field. The single versus double equal is only relevant for character fields and not numeric fields. It is also not relevant in file names in our example here, but the author prefers the selected format so that the file name describes the type of equation match and is available at a glance. Using the direct-extraction method and multiple extractions, note that the entire file name must be typed (a single = is used this time to highlight the difference from the key value extraction file names. The double equal or single equal would be relevant in the equations under the Criteria heading if the TENDERDESC1 field contained longer similar words. Even if you are using copy-and-paste shortcuts, more typing is obviously required. Step 11. For each of the output files, append a field name that is the same as the file name used (e.g., for “Tender = =Visa,” append the field name “Visa”) except for the “Tender= =Cash” file. Use the equation of PAYAMOUNT_SUM – GRATUITY_SUM. This will give us the payment by tender type without gratuities included. Step 12. Join the “Tender = =Cash” file to “1 Non Cash Grat Summary.” Designate the “Tender= =Cash” file as the primary file and the “1 Non Cash Grat Summary” file as the secondary file. Use TXNID as the Match Key Fields and include all fields from the primary file and only the NON_CASH_GRATUITY_SUM field from the secondary file. Select the “All records” in both files join option and name the file “1 Cash with Non Cash Grat.” Step 13. Append a field named CASH in the “1 Cash with Non Cash Grat file.” Use the equation of: It is necessary to add back the noncash gratuities as they are cashed out or deducted from cash received. After the adjustment, the true cash amounts are now in the CASH field. Step 14. Append all noncash files (AMX, debit, gift certificate, MasterCard, no change, and Visa) from the key value extraction procedure from step 10 to the “1 Cash with Non Cash Grat” file. Name this file “1 Tender Append” as shown in Figure 16.8. Figure 16.8 Combining All Tender Types Step 15. Summarize on TXNID using the “1 Tender Append” file and total on the numeric fields of PAYAMOUNT_SUM, CASH, AME, DEBIT, GIFT_CERTIFICATE, MASTERCARD, NO_CHANGE, and VISA. Add in the fields to include option PAYTIME_DATE and PAYTIME_TIME. These two fields may be of potential use for future analysis. Call this file “1 Tender Summary Analysis.” Step 16. Append the T_CHECK field in the “1 Tender Summary Analysis” file using the equation of: This field checks the integrity of all the previous tender-file calculations we performed. All the resulting records in the T_CHECK (total check) field should be zero to be valid. Step 17. Using the “1 Header Detail Join” file created in step 4 as the primary file, join it to the “1 Tender Summary Analysis” file created in steps 15 and 16 as the secondary file. Use the join option of “All records” in both files and the match key of TXNID as in Figure 16.9. Figure 16.9 Creating the Master File Include all fields from the primary file and, in the secondary file, include the fields of PAYAMOUNT_SUM_SUM, AME_SUM, CASH_SUM, DEBIT_SUM, GIFT_CERTIFICATE_SUM, MASTERCARD_SUM, NO_CHANGE_SUM, VISA_SUM, PAYTIME_DATE, PAYTIME_TIME, and T_CHECK (all fields except TXNID and NO_OF_RECS1). Name this file “1 Master File.” Step 18. In the “1 Master File,” append the following fields along with their related equations. C_CHECK as a virtual number field with two decimal places using the equation of: TOTAL – PAYAMOUNT_SUM_SUM. This control-check field ensures that the total bill amount was paid. If the field content is zero, then payment has been received for the order. Where the C_CHECK field is not zero, payment is still outstanding. Explanations are needed for the discrepancies. These are likely phone orders that were never picked up, canceled orders, or given to a patron as promotion, or for incorrectly cooked orders. There were 1,817 records totaling $52,104.18 in data where the field is not zero. YEAR as a virtual numeric field with 0 decimal places using the equation of: @Year(BUSDATE_DATE). The @Year function returns the year in numeric format from a date. In this case, the function is applied to the BUSDATE_DATE field. YEAR_MONTH as a virtual character field with a field length of 8 using the equation of: @Dtoc(BUSDATE_DATE, “YYYY-MM”). This function converts date field format contents into a character field. You can control the output for the converted format by specifying the date mask. In our case, the output displays as a four-digit year with a dash and then a two-digit month in character format (e.g., 2010-01). FIN_YEAR as a virtual character field with a field length of 10 using the equation of: @FinYear(BUSDATE_DATE, “0331”). The @FinYear function returns a character string of the financial or fiscal year that the date falls within. You need to select the relevant date field and input the fiscal year-end. The output display is in YYYY–YYYY format. We enter the fiscal year-end of March 31; where the BUSDATE_DATE is 21/10/2010 (October 21, 2010), the content of the FIN_YEAR field would be “2010–2011.” QUARTER as a virtual numeric field with zero decimal places uses the equation of: @Qtr(BUSDATE_DATE, “0331”). This function, from a given date, outputs the quarter in numeric format of one to four. Similar to the @FinYear function, the fiscal year-end date must be entered. Where the BUSDATE_DATE is 21/10/2010, the QUARTER field would display 3 as the third quarter based on a March 31 year-end. These additional fields allow us to perform analysis based on various date milestones such as annually, quarterly, or monthly. Step 19. Perform a Key Value Extraction using the “1 Master File.” Choose STATUS from the existing keys menu in Select Record Groups. Ensure that all four unique key values—C, D, P, and V—contain a checkmark in the box, as shown in Figure 16.10. Select the fields to output by clicking the Fields button. These fields are the ones you will be using for analysis depending on the analysis that is planned; it is at the user’s discretion to select fields. We include the following field to ensure that we have all the necessary fields for any potential tests that can be done.
Zapper Fraud
 POINT-OF-SALES SYSTEM CASE STUDY
File Preparation