The Tanker Market: Current Structure and Economic Analysis
Chapter 12
The Tanker Market: Current Structure and Economic Analysis
David Glen* and Steve Christy†
1. Introduction
What is a tanker? A tanker is defined as a vessel that is designed specifically to carry liquid cargoes. Refined oil products and crude oil are the most common types of cargo carried in such vessels, but tankers also transport chemicals, wine, vegetable and other food oils. The market for crude oil tankers is by far the largest. The markets for crude oil and refined products are often referred to as the tanker trades. This chapter reviews the world tanker market as it stands at the start of 2009. It has two objectives:
- to provide the reader with an outline of events that have shaped the present tanker market;
- to review economic theories of tanker market dynamics.
2. The Shaping of the Present Tanker Market
On the 1 January 2009, the world tanker fleet, (measured in terms of carrying capacity, the deadweight tonne) stood at 379.1mn dwt.1 The world fleet consists of around 3,605 vessels of 25,000 dwt or more, all engaged in activities related to the extraction, storage, and distribution of both crude oil and its refined products.2 One might assume that this level of activity has been reached by a steady, continuous expansion of the industry, but this is far from the case. In fact, the 1990s was a decade of “recovery” for the industry from shocks that affected it in the early 1970s, and which led to record deadweight tonnage capacity by the early 1980s. The period since 1999 has seen the first tanker market boom that has been driven by commercial factors rather than by war and political events.
Indeed, the story does not start in the tanker market at all. Its behaviour can only be understood by knowing something of the economic development of the oil industry itself. The reason for this is simple. The great bulk of oil is transported from its production areas to the main consumption areas by sea. Some is transported by pipeline, and road and rail transport are used as well for intra-country movements; but approximately 95% of the inter-area oil movements are seaborne. In 2008, approximately 2.7 billion tonnes of crude and products was exported, from a total production level of 3.9 billion tonnes.3 Thus 67% of the world’s total oil production was moved across the world, predominantly by sea, generating the source of demand for oil transportation services, and creating the demand for oil tanker services.4
The major oil consumption regions happen to be net importers of oil, so their demand creates a need to move oil safely and efficiently from its various sources. The oil tanker, which emerged as a specialised vessel during the 1940s and 1950s, was developed to meet that need.
Oil transportation can be viewed as a productive input, a part of the process that turns crude oil extracted from the ground or from under the sea, into a variety of refined products, from petrol for cars, heating oil, marine diesel fuel, feedstock for the chemical and plastics industry. The capital investment required to develop the industry was very large, with significant expenditure required to develop oilfields, construct refineries, and develop distribution systems for the products in the rapidly growing markets of the United States and Western Europe. The industry evolved as a ‘vertically integrated’ structure, with several very large multi-national companies dominating all aspects of exploration, extraction, storage, distribution and refining of the product. Investment in tankers is on-going, with approximately 5% of the fleet delivered annually by the world’s shipyards. In addition, there is an active market in the buying and selling of existing tankers for continued trading. Whilst this does not represent new capacity, it does indicate that there are relatively few barriers for new entrants wishing to join the industry.
This economic arrangement, whilst efficient, meant that the principal owners of oil tankers, and of course, their principal users, were the oil majors. By the late 1960s, the seven oil majors that dominated the global industry became known as the “Seven Sisters”. The industry was highly integrated and very concentrated. The dominant players at the time included Esso, BP, Shell, Mobil, Texaco, and Gulf. In addition, many European countries had one state-owned oil company “champion”; Italy had ENI, France had Elf and Total. In other parts of the world, state-owned companies were significant local players; for example, Petrobras in Brazil. The very largest companies had large departments whose function was to manage each of the segments of the oil production process. Oil transportation was one of those segments.
The domination of the “Seven Sisters” of the retail side of the oil industry has declined from its peak of the late 1960s. One reason for this was the emergence of a spot market for lots of refined petrol from Rotterdam, the result of refinery overcapacity. New companies entered the retail market, and put competitive pressure on the incumbents. The world of a regulated market was finally destroyed by the Arab–Israeli war of October 1973, and the resulting embargo of oil exports to certain European countries including the Netherlands, along with a dramatic rise in the oil price, from $1.80 per barrel to nearly $40 during 1973–80.5
The dramatic rise in the world crude oil price, coupled with the nationalisation of American and European oil interests in the Middle East and Libya, led to a transformation of world economic growth prospects and a shift in the balance of economic power towards OPEC (Organisation of Petroleum Exporting Countries).6 A major, and long-lived slowdown in world economic growth occurred, and a new era for the oil industry began. In the period since 2000, oil demand continued to grow, boosted by the emergence of India and China as significant consumers of energy as they grew at sustained high rates.
Much of the present structure of the tanker market has been created by these events. Indeed, the past two decades could be argued to be the first period in which the tanker market was primarily driven by economic and environmental issues, rather than politics. Political events of course, are always of potential consequence – they are woven into the history of both the industry and the tanker market.
3. Oil Consumption
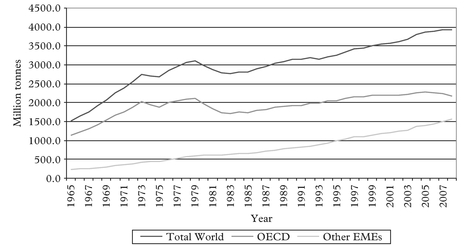
The world’s demand for oil is large, and grew at around 1.3% per annum between 2000 and 2008. Figure 1 shows the trend in world oil consumption over the past 35 years. Demand declined after 1973, recovered, peaked in 1979–80, and then fell until 1985. In fact, world oil consumption peaked at around 3,100mn tonnes in 1979, and declined by approximately 10%, to 2,801mn tonnes in 1985. The 1979 peak was not surpassed until 1990; and even in 1995 it had only reached 3,200mn tonnes, rising to 3,500mn tonnes in 2000. Between 2000 and 2008 consumption continued to grow, reaching an all time record of 3,937mn tonnes in 2007, then declining to 3,928mn tonnes in 2008.7
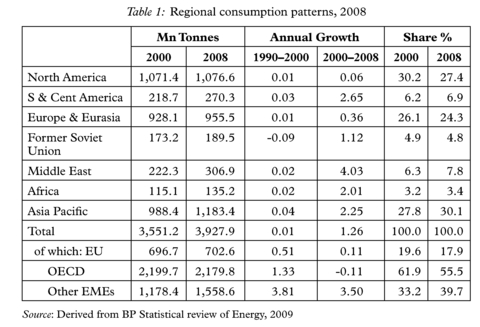
Table 1 shows that the trend growth in oil consumption over the past ten years was 1.3% per annum, consistent with the 2002 International Energy Agency (IEA) forecast (1.4%), which was conditional on assumptions about the behaviour of the price of crude oil. Its 2008 projection predicts growth at around 1% per annum until 2030.
Source: Derived from data from BP Review of World Energy, 2009
This is slower than recent experience, but still positive, despite developing environmental concerns over greenhouse gas emissions, and policy initiatives designed to lower the world’s consumption of fossil fuels. In June 2009 the IEA revised its medium-term growth projection (to 2014) to 0.6% per annum, from the 1.1% projected in 2008.8 It is possible that such revisions may be reversed in a year or two, when the word economy has recovered from the 2008–9 downturn.
The composition of oil consumption has also altered over the period, and will continue to alter in the future. Figure 1 shows the oil consumption of the OECD countries for 1965–2008. It is clear from visual inspection that the share of non-OECD members has increased over the past two decades. Despite its declining share (74% in 1965; 62% in 2000; 56% in 2008), the economic performance of the OECD countries is still important for the growth in demand for oil. By far the most significant player in this sector is the USA. In 2008 it alone accounted for nearly 1,100mn tonnes of oil (down from a 2005 peak of 1,140mn tonnes), or just under 23% of the world’s consumption. The whole of Europe and Eurasia accounts for 955mn tonnes, whilst Asia accounts for around 1,180mn tonnes. Japan, Asia’s wealthiest economy, (which has not exhibited its former growth pattern and that of the other countries in the South East/Pacific Asian economies), consumed 222mn tonnes, in 2008, approximately the same as it consumed in 1973. The major new contributors to growth since 2000 have been China, whose consumption has risen from 224mn tonnes to 376mn tonnes, and India, 106mn tonnes to 135mn tonnes in 2008. As Figure 1 shows, the emerging market economies now account for 40% of world oil consumption. Figure 1 shows that the OECD’s share has fallen sharply in the last decade. The present pattern of regional consumption is shown in Table 1.
A number of points are worthy of note. Firstly, it is clear that the annual growth of world oil consumption rose significantly between 1990–2000 and 2000–2008, from 0.01% per annum to 1.26%. The Middle East’s own consumption has risen, reflecting its own economies’ diversification and development. South and Central America and the Asia pacific regions have also grown above the world average. Second, the previous decline in consumption in the economies that constitute the former Soviet Union has been reversed. This reflects, at least in part, the well-known problems affecting these economies in the period 1989–1998. Oil consumption in this region remains lower than that in the Middle East, although its growth rate has increased to 1.1% a year. Third, the changing balance of importance, tilting economic impacts more towards the emerging market economies and away from the traditional major oil consumers, continues apace. North America’s share of oil consumption has declined to 27.4%, Asia Pacific’s rising to 30.1%. This trend is set to continue. The 2008 World Energy outlook projects all of increase in oil demand to 2030 to be derived from non-OECD countries, with 80% plus from China, India and the Middle East region.9
4. Economic Drivers of Oil Consumption
Having briefly outlined the present profile of oil consumption and its regional pattern, attention is now turned to addressing the question as the principal factors driving oil consumption. The standard set of economic factors are: Incomes (the price of crude oil and its refined products; the price of substitute products; the price of complementary products) Tastes; Political factors, and Expectations. The exposition is necessarily short. The relationship between Incomes or Gross Domestic Product (GDP) and oil consumption or its constituent components has been extensively studied. Professor Dahl has published a survey of 100 econometric studies of the relationship between gdp and petrol demand.10 She concluded that the income elasticity of demand was greater than unity, which implies that gasoline consumption will grow faster than the economy under examination. The survey reports estimates of between 0.80 and 1.38 for the long-run response.11 The short-run response was much lower however, between 0.4 and 0.5.
The second key element in the behaviour of oil consumption is the reaction of consumers to changes in the real price. Dahl reports estimated values of –0.22 to –0.31 for short-run values, and –0.58 to –1.02 for long-run values derived from the 100 studies surveyed. These figures are indeed inelastic (the proportionate fall in demand is significantly less than the proportionate rise in the price), but they relate to just gasoline demand, which constitutes around 30% of world oil consumption.12
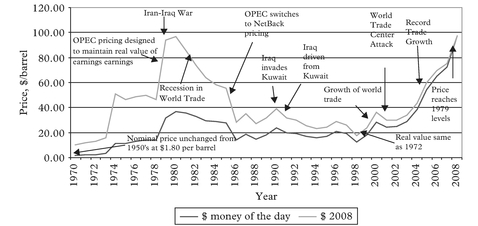
Figure 2 shows the time path of real (i.e. adjusted to reflect the changing purchasing power of the dollar over time) and nominal price (dollar price in the relevant year) of Arabian Light oil from 1972 – 2008, in annual average form. The data shows tremendous variations, from $1.90 per barrel in 1972, to $10.41 in 1974, peaking at $35.69 in 1980, declining to $12.95 in 1986, before peaking again at $20.50 in 1990, declining to a low of around $8.00 in the late 1990s, before rising in the boom of 2000, following the introduction of production quotas by OPEC members in the second quarter of 1999. The price of Brent Oil, which is highly correlated with Arabian Light, had reached $30 per barrel in 2002. From 2002–2008 the annual average price has risen to historically high levels, reaching $97 per barrel for 2008. This increase masks the
Source: BP Statistical Review of World Energy 2009
considerable volatility that exists within the year itself, but even on an annualised basis, the changes have been dramatic. It should be noted that Arabian Light is not traded as such, but is subject to “netback pricing” – a notional crude price based on the value of constituent products from a barrel of oil on the Rotterdam market, after deducting refining and sea transportation costs.
Figure 2 clearly shows that many of the peaks in the oil price are associated with Middle-East wars or other globally significant economic events. It should be noted that the Iraq war of 2002 made little impact, the main drivers being oil demand and capacity issues. The only item that might need further explanation is the apparent change in direction in the nominal price before and after 1979–1980. The primary causes were the world recession of 1979–1982, and the accelerating substitution of oil by coal for power generation, along with initiatives to reduce energy consumption in the principal consuming areas. It has been argued that the eventual abrupt relinquishment of the high price oil strategy in April 1986 was the result of joint undertakings between the world’s largest consuming nation and the OPEC’s largest producer.
The second reason relates to the changing pricing policy of OPEC members themselves. By the mid-1980s, after five years of oil prices between $25 and $20, oil production from the North Sea, and Alaska provided competition from non-OPEC suppliers; and OPEC, watching the decline in oil demand, dramatically altered its policy on oil pricing. Prior to the change, OPEC would try to maintain the real value of its earnings in nominal dollar terms. Whenever the dollar fell in value, (as it did in the 1970s), the nominal price of oil was raised to offset the fall. In the mid-1980s, OPEC members changed their policy, switching to “netback pricing”. This change, in response to declining market share as Mexican and North Sea production became more important, meant that the real price of crude oil was no longer being maintained. OPEC was under the impression that the marginal cost of non-OPEC crude was $21/barrel, and tacitly applied an $18 “benchmark” price for the basket of OPEC crudes. In fact, the real price of crude oil fell to its lowest value since the early 1970s, following the 1986 watershed. The history of oil pricing since 1990 has been one of high volatility and subject to prolonged stock-building as more non-OPEC oil came on stream. In addition, there has been periodic weakness in demand, before its recovery in the late 1990s.
When the “real price” series is examined in Figure 2, the changes in oil price over the past 30 years are even more exaggerated. It is clear that only in 2007 did oil prices exceed the levels last seen in 1979–1981. Prices have eased off since, but the high real oil price in recent years reflected two elements – a resurgence of demand growth, as noted above, and a tightening of refinery capacity margins, which itself was in part due to the low oil prices observed in the 1990s, which mitigated against significant investment in refineries during the period.
A noteworthy element of the surveys by Dahl13 is the absence, in many of the econometric studies, of cross-price effects. There may be two reasons for this. First, the investigations ignored the effects by failing to include any cross-price elements in their model. For example, it could be argued that the demand for petrol will be negatively influenced by downward changes in the price of public transport, where it is available. Thus cross-price effects may influence oil consumption. Secondly, the investigators may have tried such factors, and discarded them, when they prove to be statistically unimportant. Indeed, given the low own-price elasticities of demand, it would not be surprising if cross-price elasticities were negligible. Economic theory implies that the smaller the degree of substitutability between goods or services, the lower the level of cross-price elasticity. For many uses, oil products have few, if any substitutes.
Oil demand can be affected by changes in the price of complementary products. For gasoline consumption a vehicle is required. For fuel oil, a power station. In many cases the price of the oil product is extremely small as a proportion of the overall costs of deriving the service that it generates. It is true, however, that two of the key drivers of the growth in oil consumption in the past 50 years were the rise of the motor vehicle, and the switch to oil as a source for power generation, away from coal. The former is an example of complementarity; the latter an example of price substitution.
Shifts in tastes can influence demand. The rise of the motor car has been a major event in the western economies, and appears to be happening in the developing economies too. Until the 1970s, little or no regard was being paid to the negative effects of this expansion; namely the rise in carbon dioxide emissions, the growing evidence of the damage that lead additives to petrol caused, and the rising levels of environmental damage caused by the exploitation of the word’s resources. Environmental awareness has been raised significantly over the past 25 years, and this has had an impact on the oil industry. Energy conservation has become a key issue, although the more cynical observer is more likely to point to the oil price increase of 1973 as being the event that forced many governments to develop such policies. In addition, a number of significant oil pollution incidents led to successively tighter regulatory frameworks governing the production, distribution and transportation of oil.14
Since the end of World War II, oil has been a strategic resource. The fact that significant shares of the world’s oil resources are located in the Middle East and the Soviet Union meant that Western Europe was particularly vulnerable to disruption of oil supplies. The USA switched from being self-sufficient in oil to becoming increasingly dependent on oil, in particular from North Africa, the Middle East, Venezuela and West Africa. Major political crises punctuate the history of the oil industry, and have identifiable effects on the tanker market. The UK and French attempt to occupy the Suez Canal, following its nationalisation by Egypt, and the nationalisation of US oil interests in Libya, created tensions in the Near- and Middle East, which focused on the conflict between Israel and the Palestinians. The Egypt–Israeli war of 1967 caused the closure of the Suez Canal for eight years, and led to another clash in 1973. This was the event that precipitated a major shift in the economic balance of oil, as OPEC exercised its economic power, and raised the price of crude oil by 400% in the space of a few months. Political instability remains a theme at the present time. The 1981–1989 Iran-Iraq war, the 1990 invasion of Kuwait by Iraq, the 2001 Iraqi invasion of Kuwait and the consequent invasion of Iraq by the USA and her allies, the continuing tensions between Israel and the Palestinians, all show that oil is still a strategic product. However, a very significant change has occurred which makes it likely that embargoes will be less likely – there has been a significant shift in OPEC’s pricing strategy.
The demand for oil is also affected by players’ expectations of future events. Oil prices are volatile; nowadays some of the risk volatility can be hedged against by taking out forwards or futures contracts on the International Petroleum Exchange. Whether or not all of the risk can be hedged depends on the efficiency of the markets and the nature of the contracts available. Nevertheless, the presence of these markets allows oil companies to hedge some of the risk of current price volatility by “taking a position” on the paper markets to offset some of the risk.
The existence of such markets can also generate forward prices, which can be viewed as the market’s guess as to the future path of present (spot) prices. In some recent economic theories, current prices for a commodity or financial asset are viewed as being entirely determined by the expected price. In other words, today’s price is determined by the today’s expectation of tomorrow’s price. When political uncertainty increases, market expectations are for a shortage of oil in the future, and this leads to a sharp increase in the present price of oil. Thus expectations may play a key role in understanding market dynamics. It might be noted that the very high prices achieved by crude oil in 2007 have been blamed on “speculative” activity, with forward prices driving spot prices. This conjecture is very hard to verify.
It has been shown that the demand is very insensitive to own price, but quite sensitive to economic growth. The sharp change in conditions in 1973 led to lower growth trends for oil demand, and a significant incentive to lower the intensity of oil use. Both of these effects led to decline in oil consumption until 1985–1986, with 1975 levels reappearing only in the late 1990s. The continuing future growth of demand is sensitive to economic growth, switches to alternative energy sources, and increasing improvements in the efficiency in which oil is used, for example, in the fuel efficiencies of motor car engines.15
5. World Oil Production Trends
Not surprisingly, world oil production tends to track demand very well. There is an important element that “gets in the way” of this relationship however – oil is produced in regions were there is little demand, and traded. The time taken to move the oil to its region of consumption means that there is inventory, either in the form of oil on ships or in storage tanks at oilfields, oil terminals and refineries. In addition, since 1973 many countries have instituted strategic reserves of oil, in the event of any oil export embargo repeating itself. One estimate of the OECD countries’ crude and product inventory puts it at 2.7bn barrels, or 355mn tonnes, roughly 57 day’s supply at 2009 consumption levels.16
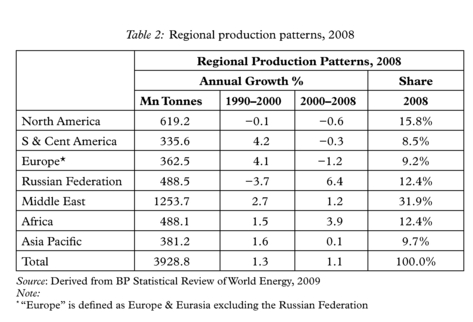
Production can therefore be divorced from consumption to a certain extent, and there will be periods when demand exceeds current production and vice versa. But over the longer period, it is consumption that drives production. Comparison of the average annual growth rate over the period 2000–2008 for world oil consumption and production yields figures of 1.26% and 1.1% respectively.
5.1 Regional production patterns
Examination of regional patterns yields a different story (Table 2). In the period 1990–2000, North American production declined slightly, and there were significant falls in production in the economies of the former Soviet Union (FSU). Elsewhere Europe and South America experienced the largest growth in production. In the period 2000–2008, the Russian Federation recovered lost ground, growing at 6.1% per annum, whilst output from African countries grew strongly. However, it is the Middle East that still dominates world production, with a 32% share in 2008, unchanged from 2000. Whilst this is lower than at some points in the past, it is also higher than at other times, particularly in the early 1980s.
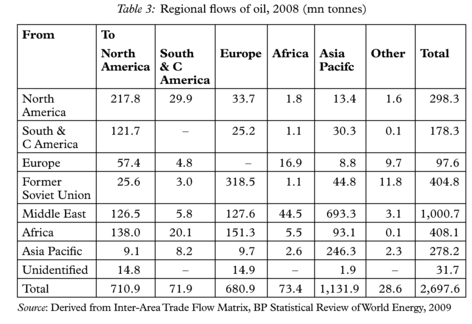
Putting the two tables of production and consumption together leads to the generation of a crude estimate of the need to move oil between one region and others; this generates a “derived demand” for oil tanker services. BP’s estimates of inter-area oil movements are shown in Table 3.
These figures will not correspond to the volumes of oil traded by sea, because the data includes other modes of transport, but they give a general indication of the major directions that oil is traded. In fact, many of the movements shown in the Table will be
entirely by sea; for example, exports from West Africa to the USA and Europe, exports from the Middle East to Japan. The trade data emphasises the importance of Middle East exports in the oil trade; In 2000, nearly 50% of the world’s oil was exported from that region. By 2008, this had fallen to 37% as some countries diversified their oil supplies. Note that the Asia-Pacific region, containing some of the most dynamic economies, obtained 61% of its oil from this region.
6. Tanker Demand
It is clear from inspection of Table 3, that the need to service consumption from the major oil production centres leads to a demand for the transportation of oil, either in its crude (unrefined) form, or in the form of refined products.
6.1 Derived Demand
Maritime economists define this demand for this service as a derived demand. That is, the need to move oil is not demanded for its own sake, as there is no intrinsic value or utility in so doing. The movement is made to “add-value” to the commodity, by selling it in a market where the marginal utility to the consumer is much higher than it is at the point of production. The process of moving the cargo is not directly determined by the consumer, as it is a part of the “supply-chain” process, and is best viewed as part of the production process. This means that the act of transporting oil is in effect, a factor input, and the laws that apply to factor demand apply to oil. There are four “Marshallian rules”17 of factor demand.
These rules are useful in indicating, from first principles, the likely demand responsiveness for oil movements to changes in freight rates. The rules are as follows:–
- The elasticity of demand for the factor input (oil transportation) will be higher (lower), the higher (lower) the elasticity of demand for the final product (petrol, fuel oil, feedstock, heating oil, etc).
- The elasticity of demand for the factor input will be higher (lower), the higher (lower) the degree of substitutability between the factor and other factor inputs in the production process.
- The elasticity of demand for the factor input will be higher (lower) the higher (lower) the share that the input takes of the overall costs the consumer of the final product.
- The elasticity of demand for the factor input will be higher, the higher the elasticity of supply of the factor input.
Having already discussed some of the evidence of the income and price elasticities of demand for the final product, it is easy to realise that the above rules imply that the elasticity of demand for oil transportation with respect to changes in the cost of transporting it (the freight rate, in the case of shipping) is very likely to be extremely small, if not zero. The reason for this is to be found in rules 1 to 3. Rule 1 implies that the freight rate elasticity of demand will be proportional to the own price elasticities of demand for the final good, which has been, at the most optimistic, been estimated at –1, with most studies in the short run yielding –0.4. Rule 2 implies that this elasticity will be lower, the lower the degree of substitutability. Whilst oil pipeline transportation can and does, have a significant role in certain parts of the world, the fact remains that the overwhelming majority of oil has to be moved by sea, or not at all. Rule 3 implies that the smaller the share of the input cost as a proportion of the final landed price to the consumer, the lower the freight rate elasticity. In the UK, it is estimated that the freight cost component in the retail price of petrol is around 1p on a current price of around £1.00 a litre; large variations in the freight rate will have almost no noticeable effect on the retail price in the UK.
The conclusion from the combination of empirical evidence and economic theory is that oil transportation demand will be highly price inelastic in most situations, but elastic with respect to changes in economic activity. Where substitute transportation forms exist however, such as major oil pipelines, or alternative fuels for vehicles, such as in Brazil, cross price elasticities may be considerable.
6.2 Demand measurement
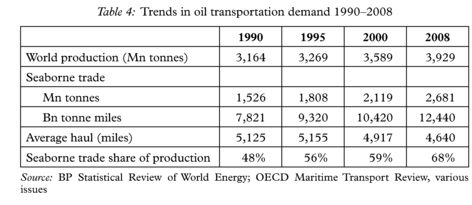
It has been demonstrated that large volumes of oil are annually transported from region to region. This provides one indicator of the derived demand for oil movements. Transportation is a non-storable service; it requires the movement of the oil cargo between two geographical points for that service to be performed. Oil demand has to be measured in two ways. First, in terms of the tonnes of oil being moved per time period; and second, in terms of the tonne miles being demanded per time period. Transportation service demand is a flow demand, and it is the product of cargo volume and distance travelled per time period that generates overall demand.18 Average voyage length is thus a proxy for route structure, since changes in that structure, say a
significant shift to short haul trades, will reduce tonne mile demand even if oil volume demand is unchanged. A shift towards long haul routes does the opposite.
6.3 Tanker demand trends
Table 4 gives some information on the trends in tanker demand, in terms of tonnes of cargo carried and tonne miles performed per year, for the period 1990–2008. It is worth noting that the average haul of crude and products movements is around 5,000 miles over this period. Whilst this appears to be relatively constant, it has not always been thus. In 1967 the average haul was 4,775 miles; in 1977, 6,651 miles. The closure of the Suez Canal between 1967 and 1975 clearly divorced tonne miles demand from tonnes demand. Over the period 1968–1973 tonne mile demand grew at an annual average of 21.4% per annum, whereas tonnage demand grew at 13.6% per annum; for the period 1978–1983 tonnage demand fell by 5.6% per annum, whilst tonne mile demand declined by 9.0% per annum.19 For the tanker markets, the main reasons for discrepancies between tonne mile demand and tonne demand are the closure of strategic routes, such as the Suez Canal, and the changing structure of oil demand patterns, towards or away from long haul trades. The early 1970s also saw the rise of the 200,000 tonne-plus tanker, or Very Large Crude Carrier (VLCC), which became dominant on long haul crude oil movements, essentially from the Middle East, to Europe and the Far East, since modified by a growing trade from West Africa to the Far East. The size and draft of these vessels made laden transit of the Suez Canal impossible, but the new technology provided sufficient scale economies to make the “distance” considerations irrelevant.
Table 4 shows clearly that the volume of oil transported has grown over the past ten years. The oil trade movement map published by BP,20 shows that there is a wide variation in the volume of cargoes being moved on the principal oil trade routes, whose structure has remained relatively stable, but which can change in response to new oil-field; developments, interruptions of existing supplies, and changing patterns of oil consumption. There are new major oil flows from West Africa to the Far East, and Singapore has become a major focal point for oil movements, reflecting the dynamism of the region in the past decade.
Source: Authors
6.4 Cyclical features
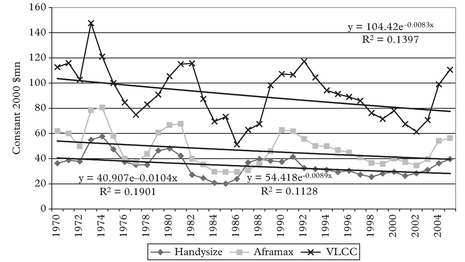
The data so far presented might suggest to the reader that demand trends are rather long term and gentle. In fact, there are very marked cycles of economic activity in the shipping markets, and the tanker industry is no different. It was argued that the most recent tanker boom, which peaked in 2001, is the first for many years that has not been triggered by an external shock, such as a Middle-East war. The marked cyclical nature of the industry can be seen in Figure 3, which shows the behaviour of real tanker prices for three size classes over the period 1970–2005. The positive deviation from the trend shows the boom periods, the negative deviation, “recession”. Asset values are a good measure of the expectations held by agents of future earnings and profitability. The most recent cycle upturn occurred in 2003 and came to an end in 2009. In the early part of the present cycle, some commentators claimed that the cycle had disappeared. Obviously they were ill-informed.
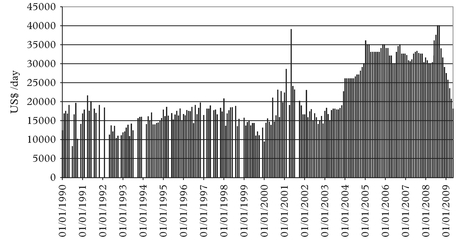
An alternative view of the market is to examine tanker charter rates, the “hire price” (in dollars per day) set for running a tanker for one’s own use, but not owning it. Figure 4 shows the historical development of one year rates from 1990 to May 2009.
The peaks in hire rates, in 1997–1998 and in 2001, are marked, especially in 2008. The recent “boom” from 2004–2008 is also apparent. These periods do not correspond to external events, and are a sign that the tanker market escaped the legacy of the 1970s and 1980s.21
Whilst every player in the tanker industry is aware that their business is cyclical, no-one has been able to develop a successful method of consistently forecasting the points at which the cycle switches from one phase to another. The cyclical behaviour of rates reflect the cyclical growth in demand, and supply, neither of which change at a constant rate.
Source: Authors Note: Blanks mean no fixtures reported in that month
7. Tanker Supply
7.1 The structure and composition of tanker supply
The tanker supply situation has become increasingly fragmented over the past 30 years. Analysts and industry observers now segment the supply side into a number of different categories. Whilst overall macroeconomic conditions will drive all segments, each component of the market has its own characteristics. After reviewing fleet developments in broad terms, these segments will be examined in more detail.
