Impact Assessments of Land-Use Change on Valued Ecosystem Services
Ecosystem service
Data requirement
1. Organic material production
NPP, the conversion coefficient from biochar to organic material, price of standard coal
2. Nutrient cycling
Nitrogen
Phosphorus
Potassium
NPP, distribution rate of nutrient elements in organic material, conversion coefficients of nutrient elements to corresponding chemical fertilizer, price of chemical fertilizer, land-use map
3. Soil conservation
Soil fertility
Digital elevation model, precipitation, soil texture, soil organic carbon, soil nutrients, vegetation coverage, price of chemical fertilizer, land-use map
Soil sedimentation
Digital elevation model, precipitation, soil texture, soil organic carbon, soil density, soil thickness, vegetation coverage, economic benefit of forest planting, land-use map
Surface soil
Digital elevation model, precipitation, soil texture, soil organic carbon, soil density, vegetation coverage, cost of reservoir construction, land-use map
4. Water conservation
Soil
Precipitation, ratio of runoff generated from precipitation, the coefficient of reducing runoff compared to bare land, cost of reservoir construction, land-use map
Water area
Precipitation, actual evapotranspiration, cost of reservoir construction, land-use map
5. Gas regulation
Oxygen production
NPP, parameter of absorbing carbon dioxide when producing 1-g dry matter
Carbon dioxide absorption
NPP, parameter of producing oxygen when producing 1-g dry matter
Many parameters (such as NPP and vegetation coverage) in the model can be either calculated by the users or directly downloaded from the Internet database (e.g., products of MODIS and SPOT). Other parameters (e.g., the conversion coefficient from biochar to organic material, ratio of runoff generated from precipitation) could be acquired from the previous researches. Soil erosion amount and actual evapotranspiration are two vital parameters of the model. NESM can automatically calculate the soil erosion amount using the Universal Soil Loss Equation according to the data input in Table 3.1. However, the calculation of actual evapotranspiration was not designed in the model for the complicated calculation process. Users need to generate this data input themselves.
Most of the parameters have obvious spatial variation. However, because of the lack of reliable data, we utilized a unified parameter in the whole NCP for several parameters such as the distribution rate of nutrient elements in organic material, the ratio of runoff generated from precipitation, and the coefficient of reducing runoff compared to bare land.
Buffer Comparison Method
Using NESM and required data input, we can map the ESV under different land use and climate scenarios. However, whether the changes in ESV were a result of land-use change or climate change is not known. To solve the problem, we developed a buffer comparison method.
As shown in Fig. 3.1, pixel e was converted from cultivated land to urban areas during 1988–2008. The changes in ESV in pixel e are the combined effects of land use and climate change. However, pixels c, d, f, h, and i did not undergo land-use change from 1988 to 2008. Climate change itself determines the changes in ESV. In other words, changes in ESV in pixels c, d, f, h, and i are the consequences of climate change.
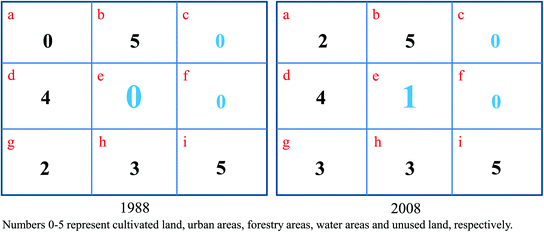

Fig. 3.1
The mechanism distinguishing the effects of land-use change from climate change on ESV
In 1988, pixels c, e, and f are all cultivated land (Fig. 3.1). Since climate is highly autocorrelated in adjacent pixels, we assumed that the physical geography conditions and climate change in pixels c, e, and f are the same for the close location. The change percentages in ESV resulting from climate in pixel e should be equal to that of pixel c and f. Thus, we assessed the effects of climate change on ESV in pixels e, i.e., the average change percentage in ESV of pixels c and f. Subtracting the average change percentage in pixel c and f (ESV changes due to climate change) from the actual change percentage in pixel e (combined influences of land-use and climate change), we can calculate that the ESV changes resulted from land-use change in pixel e.
How to determine the buffer distance is the next problem. If the buffer distance is too close, we may not find the same unchanged land-use type (e.g., pixel c and f in Fig. 3.1) in 1988. In addition, the errors in land-use classification could generate interference on the result. If the buffer distance is too far, the physical geography conditions and climate change in these pixels could be significantly different from that in pixel e (Fig. 3.1). To solve the problem, we assessed the sensitivity of the ESV change to the buffer distances (Fig. 3.2). It was found that the ESV of cultivated land has a significant inflection point at the distance of 5 km. It means that the physical geography conditions and climate change within 5 km are similar to that of the converted areas, while significant differences exist beyond 5 km. Thus, we decided to create a 5 km buffer zone to find the unchanged cultivated land during 1988–2008, which could provide a reference for the effects of climate change on ESV.
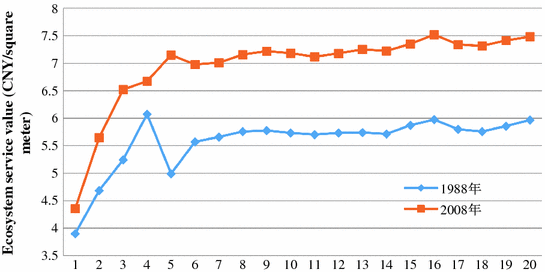

Fig. 3.2
Sensitivity of ESV changes in response to buffer distances in the North China Plain for both 1988 and 2008
Contributions of Land-Use and Climate Change on ESV
Based on the buffer comparison method, we further developed an equation to distinguish the contributions of land-use and climate change on ESV.


where C lucc is the contribution of land-use change on ESV; CP act is the actual change percentage in ESV in converted areas, i.e., areas converted from cultivated land to urban areas during 1988–2008; CP bz is the change percentage in ESV in buffer zone; and C cc is the contribution of climate change on ESV.

(3.1)

(3.2)
Results
Cultivated Land Loss Due to Urbanization in NCP
Urban areas in NCP increased to 12,648 km2 in 2008 from 6036 km2 in 1988, with a change percentage of 108.54 %. The annual expansion ratio of urban areas in NCP reached 5.48 % a year. Urban areas expanded faster in western NCP, i.e., regions around Beijing, central Hebei, central Henan, and northwestern Shandong, with urbanization ratios over 300 % (Fig. 3.3). Urban expansion ratios are lower in southeastern NCP, i.e., regions in northern Anhui and Jiangsu provinces. Most of the urban expansion ratios in these areas were less than 50 % during 1988–2008 (Fig. 3.3).
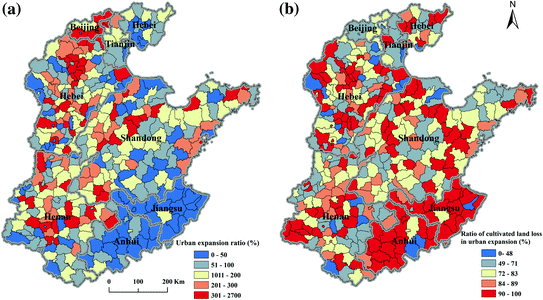

Fig. 3.3
Urban expansion rate (a) and cultivated land loss ratio in urban expansion (b) in the North China Plain during 1988–2008
Ratio of cultivated land loss due to urban expansion reached 76.48 % in NCP during 1988–2008. In addition, about 19.89 % of expanded urban areas were converted from other construction land (i.e., rural settlement, industrial, and mining land). The lost proportions of forestry areas, grassland, and water areas due to urban expansion are as low as 0.75, 1.19, and 1.36 %, respectively. Cultivated land contributed to most of the expanded urban areas. The spatial pattern of cultivated land loss ratio in urban expansion is opposite to that of urban expansion ratio. The ratio of cultivated land loss in urban expansion is higher in southeastern NCP, ranging from 90 to 100 % (Fig. 3.3). Urban expansion consumes less cultivated land in western NCP, with a ratio of cultivated land loss lower than 60 %.
Actual Changes in ESV Due to Conversions from Cultivated Land to Urban Areas
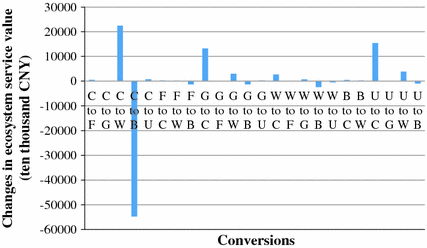
The value of total ecosystem service of converted cultivated land in 1988 is about 3911.17 USD/ha (e.g., in 2008 USD) (Table 3.2). Value percentage of nutrient cycling, water conservation, gas regulation, provision of organic production, and soil conservation are 0.32, 22.77, 15.69, 51.17, and 10.05 %, respectively. After the conversion from cultivated land to urban areas, the value of total ecosystem service decreased by 8.94 % (349.33 USD/ha) during 1988–2008. Three kinds of ecosystem services presented a decreasing trend, while two ecosystem services increased.
Table 3.2
Actual changes in ecosystem service value in NCP during 1988–2008
Ecosystem service value in (USD/hm2) | Value change (USD/hm2) | Change percentage (%) | ||
|---|---|---|---|---|
1988 | 2008 | |||
Total ecosystem service | 3911.17 | 3561.84 | −349.33 | −8.94 |
Nutrient cycling | 12.33 | 10.96 | 1.37 | −3.18 |
Water conservation | 890.46 | 0.00 | −890.46 | −100 |
Gas regulation | 613.73 | 746.62 | 132.88 | 21.54 |
Organic production | 2001.48 | 2431.64 | 431.53 | 21.54 |
Soil conservation | 393.17 | 372.62 | −20.55 | −5.5 |
The ecosystem service of water conservation vanished (decreased by 100 %) when cultivated land was converted to urban areas. The ESV of soil conservation and nutrient cycling also decreased by 5.50 and 3.18 %, respectively. However, ESV of gas regulation and organic production increased by 21.54 and 21.54 %, respectively. The changes in ESV are the combined results of climate and land-use change.
Effects of Land-Use Change on ESV
According to the buffer comparison method, we assessed the effects of land-use change on ESV when converting cultivated land to urban areas. Land-use change led to the overall decrease of ESV except for soil conservation in the conversion (Table 3.3). Urban expansion resulted in the complete loss of water conservation function. Ecosystem service functions of nutrient cycling, gas regulation, and organic production also decreased by 31.91, 7.18, and 7.18 %, respectively. However, urban expansion improved the function of soil conservation with an increase of ESV of 2.40 %.
Table 3.3
Effects of climate and land-use change on ESV in NCP during 1988–2008
Actual change (%) | Effects of climate change (%) | Effects of land-use change (%) | |
|---|---|---|---|
Total ecosystem service | −8.94 | 25.72 | −34.66 |
Nutrient cycling | −3.18 | 28.73 | −31.91 |
Water conservation | −100.00 | 24.03 | −100.00 |
Gas regulation | 21.54 | 28.73 | −7.18 |
Organic production | 21.54 | 28.73 | −7.18 |
Soil conservation | −5.50 | −7.90 | 2.40 |
Land-use change significantly reduced the total ESV in central NCP (decreased by 43–100 %), while it increased the ESV in western NCP (ranging from 15 to 128 %) (Fig. 3.4). Except for several regions in northwest, the water conservation function all decreased by 100 % in NCP. The soil conservation function was improved in 65.28 % of the counties in NCP due to urban expansion. The increase of the soil conservation function is particularly significant in eastern NCP, i.e., Shandong Peninsula. However, it decreased remarkably in southwestern NCP (Fig. 3.4).
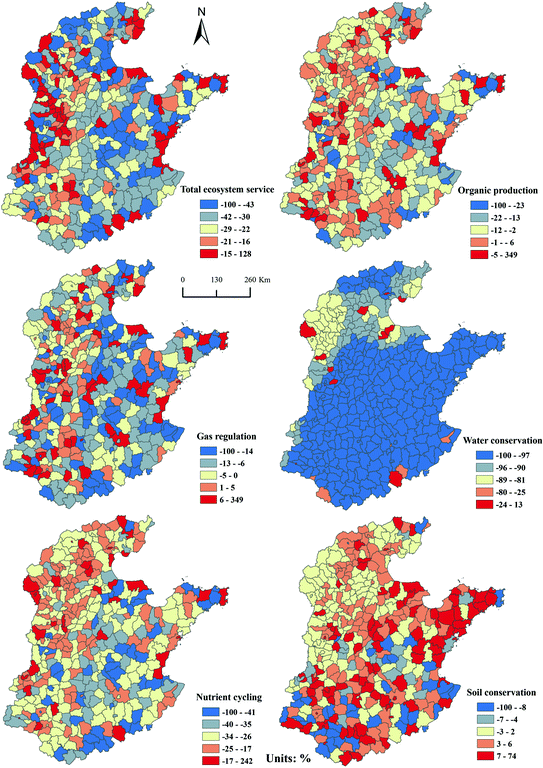

Fig. 3.4
Percentage change in ESV induced by land-use change in the North China Plain
Organic material production and the gas regulation function decreased in 70.91 % of counties in NCP, while the nutrient cycling function decreased in over 98 % of counties in NCP. The decrease of nutrient cycling is more significant than that of organic production and gas regulation. The decrease of nutrient cycling is larger in central NCP than that in western NCP. The regions that the gas regulation and organic production increased was scattered across the entire NCP. However, the number of counties experiencing increase in gas regulation and organic production gradually decreased from the western NCP to eastern NCP.
Contributions of Land-Use and Climate Change on ESV
In the conversion from cultivated land to urban areas, land-use change accounted for 57.40 % of the changes in ESV, while climate change resulted in 42.60 % of the changes in ESV. For different ecosystem services, land-use change accounted, on average, for 52.62, 80.63, 19.99, 19.99, and 23.30 % of changes in ESV for nutrient cycling, water conservation, gas regulation, organic production, and soil conservation, respectively (Fig. 3.5). Land-use change has a major influence on water conservation and nutrient cycling, while the main effects of climate change are on gas regulation, organic production, and soil conservation.
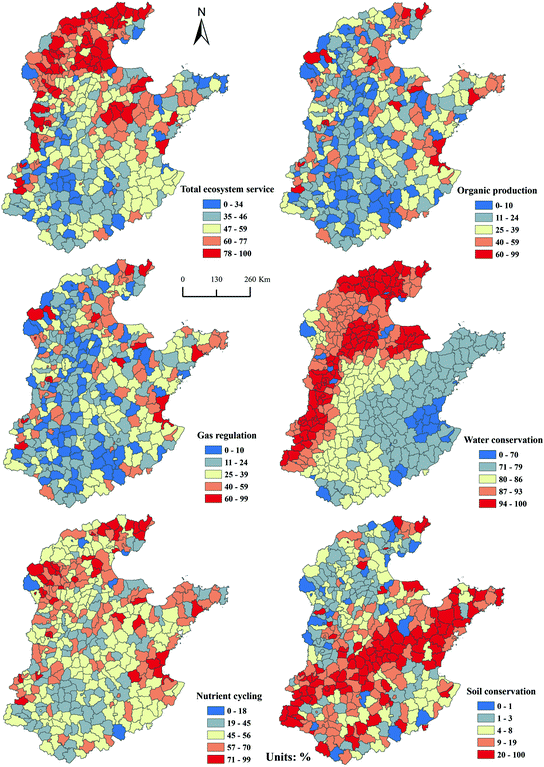

Fig. 3.5
Contribution of land-use change on changes in ESV in NCP
The effects of land-use change on ESV are more significant in northwestern NCP than any other region in NCP (Fig. 3.5). Land-use change in these areas accounted for over 60 % of the changes in ESV. However, in northern NCP, the effects of land-use change on ESV are generally lower than 45 %. The influence of land-use change on water conservation gradually decreased from northwestern NCP to southeastern NCP. The effects of land-use change on soil conservation is particular significant in a northeast–southwest strip (Fig. 3.5). The effects of land-use change on organic production, gas regulation, and nutrient cycling are similar, i.e., they gradually decreased from the east to the west in NCP.
Causes of the Changes in Ecosystem Service in the Process of Urbanization
There are many trade-offs in ecosystem service in urban expansion, i.e., an increase in soil conservation, while there is a decrease of water conservation, nutrient cycling, gas regulation, and organic production. Urban areas are mostly soil sealed, which means that soil erosion does not easily occur. However, cultivated land usually leads to soil erosion under certain conditions, such as in sloping areas, low vegetation cover, and heavy rainfall.
For the soil sealing in urban areas, urban land almost has no water conservation function. When cultivated land was converted to urban areas, the water conservation function almost vanished. The nutrient content of nitrogen in cultivated land is similar to that of an urban ecosystem. However, the nutrient content of phosphorus and potassium in urban ecosystem is far below than that in cultivated land. Therefore, in the conversion from cultivated land to urban areas, the nutrient cycling value of phosphorus and potassium significantly decreased.
Theoretically, if expanded urban areas are all soil sealed, the functions of organic material production and gas regulation will significantly decrease for the loss of vegetation. In this study, we found that land-use change resulted in a decrease of 7.18 and 7.18 % for the organic material production and gas regulation. It can be explained from two perspectives. First, we utilized the land-use change data with a spatial resolution of 1 km. There will be many mixed pixels of urban areas and cultivated land. Although many pixels in land use were classified as urban areas, vegetation could still emerge in these pixels forming functions of organic material provision and gas regulation. Second, there may be many mistaken classification errors in urban areas, i.e., much of the cultivated land close to cities was reclassified as urban areas.
Comparisons Between the Buffer Comparison Methods with Other Previous Methods
Separating the effects of land-use change from climate change on ESV has always been difficult for the complicated mutual influences between them. In the previous researches, two approaches were usually adopted to do this work, i.e., econometrics analysis and scenario analysis. Econometrics analysis identifies the effects of land-use and climate change on ESV by regression or correlation analysis (Heubes et al. 2012). For example, Su and Fu (2013) found that precipitation in the Chinese Loess Plateau significantly influenced the water yield, while the land-use conversion from cropland to grass/woodland significantly influences the sediment control. Econometrics analysis can judge whether land-use or climate change significantly influences ESV, while it fails to assess the degree of the influence.
In scenario analysis, three scenarios were generally developed, i.e., pure climate scenario (no land-use change), pure land-use change scenario (no climate change), and combined scenario (changes in both climate and land use) (Geng et al. 2014). The influence of land-use and climate change on ESV can be clearly presented by assessing the changes in ESV under different scenarios. The contribution of climate and land-use change on ESV can also be assessed in scenarios analysis. However, scenario analysis still faces great challenges in scenario creation. Many pure scenarios of climate and land-use change are difficult to be created for the complicated mutual effects between them. For example, soil erosion is determined by a great deal of factors, e.g., precipitation, land use, slope, and vegetation coverage. Precipitation, land use, and slope can be easily controlled in scenario creation. However, the vegetation coverage, which is usually directly calculated by remote sensing, is a combined result of land-use and climate change. It is difficult to create a pure climate vegetation coverage without the influences of land-use change and vice versa. Therefore, the application of scenario analysis method is greatly limited.
The buffer comparison method developed in this study can directly assess the contribution of land-use and climate change on ESV. It could be viewed as an improved scenario analysis method. Buffer comparison method factually developed two scenarios, i.e., pure climate scenario and combined scenario. The influence of land-use change on ESV was indirectly deduced by the two scenarios. Since there is no land-use change in buffer zones, pure climate scenario can be easily created and applied in all ESV assessment. The application range of this method is widely enhanced.
Uncertainty of the Assessment
The MEA classifies the functions of ecosystem services into provisioning (e.g., provision of food and fiber), regulation (e.g., regulation of climate through carbon storage), cultural (e.g., recreational values), and supporting services (e.g., nutrient cycling and soil formation). Because of the lack of available data and method in mapping cultural services, we only assessed five ecosystem functions in provisioning, regulation, and supporting services. The cultural function changes in the process of urbanization were not assessed, which added much uncertainty in the assessment.
The spatial resolution of the data we utilized to assess ESV and urban expansion is 1 km. The data could be a little coarse for analyzing urban expansion and generate many mixed pixels of urban areas and other land-use types. If the mixed pixels were classified as urban areas, the NPP and NDVI in urban areas could be overestimated. The ESV closely related NPP and NDVI (e.g., organic material production, nutrient cycling) could be consequently overestimated.
Summary
We examined the urban expansion and the cultivated loss in NCP during 1988–2008. It was found that urban areas in NCP increased by 108.54 % during 1988–2008. Urban areas expanded faster in northwestern NCP, i.e., regions around Beijing, but expanded slower in southeastern NCP, i.e., northern Anhui and Jiangsu provinces. Urban expansion in NCP leads to significant cultivated land loss. About 76.48 % of the expanded urban areas were converted from cultivated land. Furthermore, cultivated land loss is more serious in the regions with a low urban expansion speed.