Demographic Profile, Spatial Mobility and Residence of Beijing’s In-Migrants: Data from the 2010 Census
(1)
College of Resource Environment and Tourism, Capital Normal University, Beijing, China
Abstract
This chapter follows with an analysis of the characteristics (including employment and residence traits) and spatial distributional changes of migrant workers in Beijing between 2000 and 2010. In comparing the census data of 2000 with that of 2010 with the towns and sub-districts as spatial units, this chapter identifies the flow-in and flow-out areas of Beijing’s migrant population at the municipal level. The census data also reports upon the residence status of migrant workers in Beijing, including their housing sources, living conditions and specific housing difficulties. A comparison of the demographic profiles of the local and non-local populations at the city level is also given.
4.1 Introduction
The quantitative analysis of the characteristics, residence status and the spatial mobility of migrants in Beijing is based on a variety of official data issued from the following sources:
Population census
Economic survey
Land survey
Housing survey
Statistical book.
The census data used in this chapter comes from the official publications in China, as shown in Table 4.1.
Table 4.1
Summary of the main data resources used in this Chapter
Data | Resources |
|---|---|
Population census | Tabulation on the 2000 Population Census of the People’s Republic of China by County (Population Census Office under the State Council 2000a) |
Tabulation on the 2000 Population Census of the People’s Republic of China by Township (Population Census Office under the State Council 2000b) | |
Tabulation on the 2010 Population Census of the People’s Republic of China (Population Census Office under the State Council 2010a) | |
Tabulation on the 2010 Population Census of the People’s Republic of China by County (Population Census Office under the State Council 2010b) | |
Tabulation on the 2010 Population Census of the People’s Republic of China by Township (Population Census Office under the State Council 2010c) | |
Tabulation on the 2010 Population Census of Beijing Municipality—Non-Native Permanent Population Volume (Office for the 6th Population Census of Beijing Municipality 2010a) | |
Tabulation on the 2010 Population Census of Beijing Municipality—Town and Sub-District Volume (Office for the 6th Population Census of Beijing Municipality 2010b) | |
Economic survey | Beijing 2008 Economic Census Yearbook, the 2nd National Economic Census Leading Group Office in Beijing |
Rural economic census | The 2nd National Agricultural Census of Beijing (2008), the 2nd National Agriculture Census Leading Group Office in Beijing |
Land survey | The 1st and 2nd Land Survey in Beijing (1996 and 2006), Beijing Municipal Bureau of Land and Resources |
Rural housing survey | Housing Survey on the Rural Residents in Beijing (2005), Beijing Municipal Agricultural Committee |
Statistical book | Beijing Statistical Yearbook (2011), Beijing Municipal Bureau of Statistics |
4.2 Demographic Profile of Beijing’s Migrants in 2010
4.2.1 Growth in Beijing’s Migrant Population, 2000–2010
The in-flow of migrants into Beijing has accelerated considerably since Beijing’s pro-market reforms. The decade from 2000 to 2010 witnessed a growth in the migrant population of 4.5 million (as illustrated in Table 4.2), representing more than double the increase in migrants in the previous decade of 1990 to 2000, which saw an increase of two million migrants. During the 2000–2010 period, migrant growth contributed 75 % of the visible increase in Beijing’s total population.
Table 4.2
Growth of migrant population in Beijing, 1982–2010
1982 | 1990 | 2000 | 2010 | 82–90 annual growth rate % | 90–00 annual growth rate % | 00–10 annual growth rate % | |
|---|---|---|---|---|---|---|---|
Registered permanent residents | 9,178 | 10,322 | 11,075 | 12,572 | 1.5 | 0.7 | 1.3 |
Non-registered permanent residents | 172 | 538 | 2,561 | 7,047 | 15.3 | 16.9 | 10.7 |
Total permanent residents (thousand) | 9,350 | 10,860 | 13,636 | 19,619 | 1.9 | 2.3 | 3.7 |
The growth of Beijing’s migrants, however, was reported at a lower annual rate of 10.7 % from 2000 to 2010, compared to the previous decades of 1990–2000 and 1982–1990, which reported 16.9 % and 15.3 % growth respectively (see Table 4.2).
Figure 4.1 compares the reported composition of Beijing’s total migratory population between 2000 and 2010. Three migratory groups are identified and the measures for each group are described in Fig. 4.1:
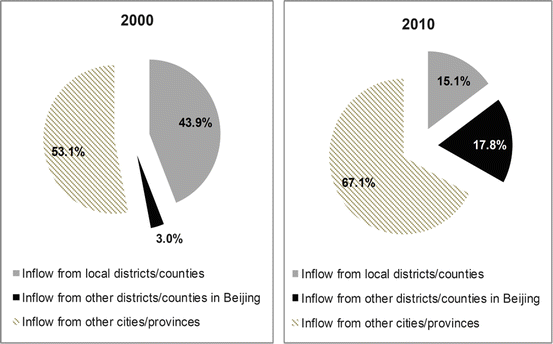
Inflow from local districts/counties
Inflow from other districts/counties in Beijing
Inflow from other cities/provinces.

Fig. 4.1
The structure of Beijing’s total migratory population, 2000–2010 (Source: 5th and 6th Population Census 2000 and 2010)
The total migratory cases reported in 2000 (4.6 million) have more than doubled in 2010 (10.5 million). The intra-city mobility of Beijing’s residents explains 46.9 % and 32.9 % of the above total migratory cases in 2000 and 2010 respectively.
The inflow of migrants in 2010 (7.0 million) has almost tripled that of 2000 (2.5 million). The inflow from other cities/provinces accounted for 53.1 % and 67.1 % of the total migratory cases in 2000 and 2010 respectively. This has proven that the scale, significance and influence of a large migrant inflow to Beijing have become greater in recent years.
4.2.2 Structural Features of Beijing’s Migrants in 2010
4.2.2.1 The Age Structure of Beijing’s Migrants in 2010
As reported in the 6th National Population Census, migrants in the 20–39 age group accounted for 62.8 % of the total migrant population in Beijing in 2010: 19.9 % (1.4 million) were in the 20–24 age group, 18.0 % (1.27 million) in the 25–29 age group, 13.5 % (0.95 million) in the 30–34 age group and 11.3 % (0.8 million) in the 35–39 age group (see Fig. 4.2).
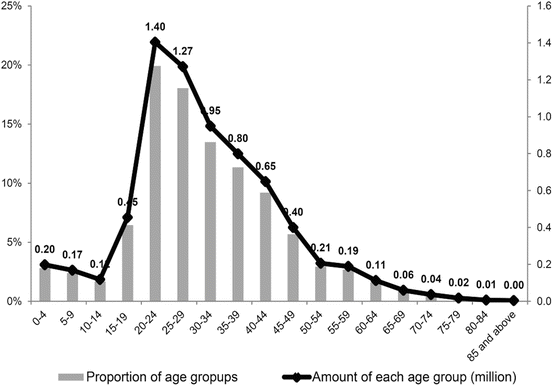

Fig. 4.2
Age structure of Beijing’s migrants and the proportion of each age group in the total migrants in 2010 (Source: 6th Population Census 2010a)
Both Figs. 4.3 and 4.4 contrast against the age structure reported by the 2010 6th National Population Census between Beijing hukou holders and their migrant counterparts. Migrants represent the non-registered permanent residents who have stayed for more than 6 months in Beijing. It is found that Beijing’s migrants have a much younger age structure than that of their local counterparts. There are two age group clusters among the locally registered permanent residents in 2010: (a) the 45–59 age group which makes up 26.9 % of Beijing hukou holders; and (b) the 20–29 age group which accounts for 18.6 % of the local population. This indicates a visible intergenerational relation between the two baby boom periods, resulting in the prediction of an aging society in Beijing in the near future.

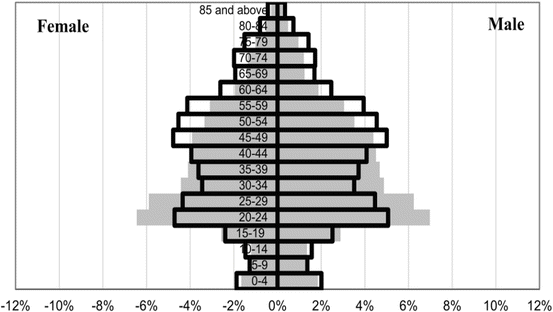

Fig. 4.3
Age structure of Beijing’s total population and migrants in 2010 (Source: 6th Population Census 2010a. Note: The bold black frame refers to the migrants, while the grey areas refer to Beijing’s total population)

Fig. 4.4
Age structure of Beijing’s total population and locally registered permanent residents in 2010 (Source: 6th Population Census 2010a. Note: The bold black frame refers to the locally registered permanent residents, while the grey areas refer to Beijing’s total population)
Table 4.3 shows the proportion of chief breadwinners (15–59 age group) across three population groups out of Beijing’s total permanent residents, composed of the locals and migrants. Three indexes of an aging society are listed in each population group:
Breadwinner rate = (Population 14 years old and below + Population 65 years old and above)/Population between 15 and 64 years old who are part of the society’s working population
Baby raising rate = Population 14 years old and below/Population between 15 and 64 years old
Senior citizen raising rate = Population 65 years old and above/Population between 15 and 64 years old
Table 4.3
Proportion of breadwinners in Beijing in 2010
The proportion in each population group | Breadwinner rate | ||||||
|---|---|---|---|---|---|---|---|
0–14 % | 15–59 % | 60 and above % | Total % | Breadwinner rate % | Baby raising rate % | Senior citizen raising rate % | |
Registered permanent residents | 9.6 | 72.7 | 17.7 | 100 | 37.5 | 13.2 | 24.3 |
Non-registered permanent residents | 6.9 | 89.7 | 3.4 | 100 | 11.4 | 7.7 | 3.8 |
Total permanent residents | 8.6 | 78.8 | 12.5 | 100 | 26.8 | 10.9 | 15.9 |
The obtained values of the breadwinner indexes show a sharp contrast in age group structure between the local and non-local populations. In 2010, the senior citizen raising rate for migrants was reported at an extreme low of 3.8 %, whereas the value for the local hukou holders was as high as 24.3 %. A similar situation is found when comparing the baby raising rate between local and non-local populations in Beijing, although their variance is not as significant as the above. It is believed that a young age structure of migrant workers is a ‘demographic bonus’ (a demographic potential for high economic growth) for the host city, as the city has been economically activated without being further burdened by a flood of young workers (see Figs. 4.3 and 4.4 and Table 4.3, see Cai 2012). Their visible economic contribution explains the ease of registration control (hukou) since the late 1970s, which has greatly driven the urbanization process and set the pace for urban developments in the last three decades.
4.2.2.2 The Sex Ratio of Beijing’s Migrants in 2010
The sex ratio of Beijing’s migrants was reported to be 1.19 averaged over the whole migrant population in 2010, indicating an obviously higher proportion of male than female migrants. The sex ratio, however, was quite balanced for the local hukou holders, at a reported 1.01. Among all the permanent residents in Beijing, the sex ratio was 1.07. Table 4.4 lists the sex ratios of male to female in each age group for each population group. The migrants belonging to the 0–59 age group have a sex ratio that is visibly unbalanced (above 1.2), demonstrating a male-dominated migration, with the 20–29 age group as an exception (with a sex ratio of only 1.09). In Sect. 4.3.1, the reasons for this exceptional sex-ratio in the 0–59 age group of Beijing’s migrants will be given.
Table 4.4
Sex ratio within Beijing in 2010
Age groups | Sex ratio of male to female | ||
|---|---|---|---|
Registered permanent residents | Non-registered permanent residents | Total permanent residents | |
0–4 | 1.07 | 1.22 | 1.11 |
5–9 | 1.07 | 1.28 | 1.13 |
10–14 | 1.07 | 1.27 | 1.11 |
15–19 | 1.05 | 1.21 | 1.12 |
20–24 | 1.07 | 1.09 | 1.08 |
25–29 | 1.03 | 1.09 | 1.06 |
30–34 | 1.02 | 1.18 | 1.10 |
35–39 | 1.02 | 1.29 | 1.14 |
40–44 | 1.03 | 1.35 | 1.15 |
45–49 | 1.05 | 1.40 | 1.12 |
50–54 | 1.00 | 1.40 | 1.05 |
55–59 | 0.95 | 1.16 | 0.98 |
60–64 | 0.94 | 1.08 | 0.96 |
65–69 | 0.87 | 1.02 | 0.89 |
70–74 | 0.87 | 1.08 | 0.88 |
75–79 | 0.93 | 1.06 | 0.94 |
80–84 | 0.90 | 0.92 | 0.90 |
85 and above | 0.77 | 0.65 | 0.76 |
Total | 1.01 | 1.19 | 1.01 |
4.2.2.3 The Educational Level of Beijing’s Migrants in 2010
Table 4.5 compares the educational level of Beijing’s local and non-local populations, specifically focusing on the population aged 6 years old and above. The proportion of those who are illiterate and those with only elementary education in the population is visibly higher among the locals than that for the migrants. For the remaining educational groups, the demographic profile shows that the migrants tend to be poorly educated compared to their local counterparts. Around 45.9 % of the migrants have attained a junior high school education and a mere 13.3 % of them have attained degrees in universities (including higher degree programmes). The proportion of locals with a higher education is clearly larger, at a reported 24.1 % in 2010. The relatively poor educational background of Beijing’s migrants would lead to them having a comparatively disadvantaged status in the labour market, resulting in a high probability of them being forced to receive a low job rank and low salary in the host city. The following section will elaborate on the migrants’ job ranks in Beijing.
Table 4.5
Educational level of the Beijing population in 2010
Educational level | Registered permanent residents % | Non-registered permanent residents % | Total permanent residents % |
|---|---|---|---|
Illiterate or uneducated | 2.6 | 0.8 | 1.9 |
Elementary school | 10.9 | 9.4 | 10.4 |
Junior high school | 25.2 | 45.9 | 32.7 |
Senior high/trade school | 23.6 | 19.5 | 22.1 |
Junior college | 13.6 | 11.0 | 12.6 |
University | 19.2 | 11.9 | 16.5 |
Post-graduate | 4.9 | 1.5 | 3.7 |
Total | 100 | 100 | 100 |
4.2.2.4 The Occupational Structure of Beijing’s Migrant Workers in 2010
Table 4.6 contrasts the job ranks of employment populations between the local and non-local permanent residents. The data in Table 4.6 refers to the currently employed population, excluding the laid-off workers and nonworking groups. It is reported that the employees out of the total permanent residents sum to 9.8 million in 2010 in Beijing; and the employed migrants total up to 4.5 million.
Table 4.6
Job ranks of the Beijing population in 2010
Occupational Structure | Registered permanent residents % | Non-registered permanent residents % | Total permanent residents % |
|---|---|---|---|
Managers or cadres | 3.5 | 2.3 | 3.0 |
Professionals | 26.6 | 13.1 | 20.4 |
Secretarial workers | 19.9 | 10.2 | 15.5 |
Primary industrya workers | 9.4 | 1.5 | 5.8 |
Manufacturing and transportation workers | 18.8 | 24.8 | 21.5 |
Commerce and services (sales, catering etc.) | 21.7 | 48.1 | 33.8 |
Others | – | – | – |
Total | 100 | 100 | 100 |
It is demonstrated that 48.1 % of the migrant workers in Beijing are engaged in commerce and services which consist of mostly lower-end jobs instead of higher-end jobs such as managers/officials and professionals. The second largest employer of migrants would be the manufacturing and transportation industries, which hire 24.8 % of the migrant workers. The occupational profile of the population of locals who are employed stands in sharp contrast to that of the migrant workers. The most important job opportunities for Beijing’s local people are a variety of positions available in research, education, healthcare and other public services (termed as ‘Shiye danwei’) or in other fields such as engineering, technology, counselling, finance, publishing and media services. These higher-end service jobs require various degrees of professional knowledge and provide relatively high earnings for such professionals. Almost 26.6 % of the local workers are professionals, implying an easier entry of well-educated hukou holders into the mainstream economy of the capital city. The relatively poor educational background among the migrants (see Table 4.5) explains the local-non-local gap in terms of job rank (see Table 4.6) and the stability, prospect and earnings of the job they are engaged in.
4.3 In-Migration of Beijing’s Migrants in 2010
4.3.1 Reasons for In-Migration of Beijing’s Migrants in 2010
Both Table 4.7 and Fig. 4.5 list the main in-migration reasons for Beijing’s migrants, with male and female groups displayed respectively. The pursuit for a job is the top reason for their migration to Beijing, which explains 73.9 % of the inflow of migrants.
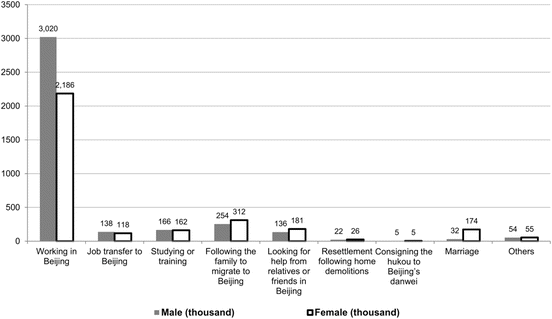
Table 4.7
Reasons for in-migration of Beijing’s migrants in 2010
In-migration reasons | Motivation structure for migrating to Beijing | ||
|---|---|---|---|
Male % | Female % | Total migrants % | |
Working in Beijing | 78.9 | 67.9 | 73.9 |
Job transfer to Beijing | 3.6 | 3.7 | 3.6 |
Studying or training | 4.3 | 5.0 | 4.7 |
Following the family to migrate to Beijing | 6.6 | 9.7 | 8.0 |
Looking for help from relatives or friends in Beijing | 3.5 | 5.6 | 4.5 |
Marriage | 0.8 | 5.4 | 2.9 |
Resettlement following home demolitions | 0.6 | 0.8 | 0.7 |
Consigning the hukou to Beijing’s danwei | 0.1 | 0.2 | 0.1 |
Others | 1.4 | 1.7 | 1.5 |
Total | 100 | 100 | 100 |

Fig. 4.5
In-migration reasons given by Beijing migrants in 2010 (Source: 6th Population Census 2010a)
However, in comparison to the male migrants, the proportion of female migrants with job pursuit as their top motive for migrating to Beijing is relatively lower (67.9 %). Almost 20.7 % of female migrants come to Beijing as a result of following their family (9.7 %), their relatives or friends (5.6 %) or their spouse (5.4 %). These reasons for mobility explain the gap between female migrants and male migrants, as revealed in Table 4.7 and Fig. 4.5.
Figure 4.6 shows the distribution of in-migration reasons across the different age groups of Beijing’s migrants. For the working population in the 15–59 age group, the pursuit for a job is their top motive for mobility. For the remaining nonworking population, they mainly follow their family, spouse, relatives or friends to migrate to Beijing.
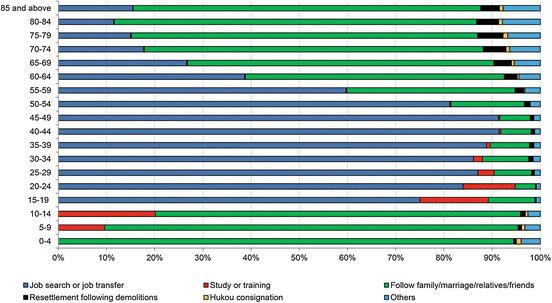

Fig. 4.6
In-migration reasons given for each age group of Beijing migrants in 2010 (Source: 6th Population Census 2010a)
Figure 4.7 shows the distribution of main migration motives among the female migrants’ age groups. Table 4.4 illustrates a well-balanced sex ratio (1.09) for the 20–29 age group, whereas the other age groups within the 0–59 age range reveal a male-dominated migration, with a sex ratio reported at above 1.2 or even 1.4. Figure 4.7 gives an explanation for such a male-female balance in the 20–29 age groups.
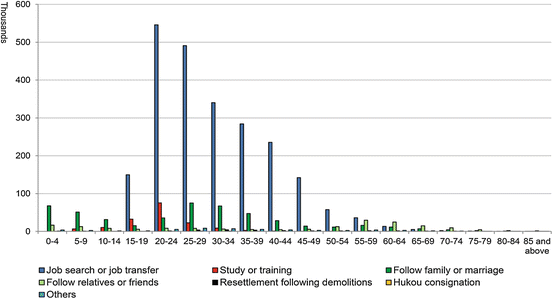
In the 20–24 age group, the number of female migrants following their family or spouse to migrate to Beijing totals up to 35.7 thousand, which is more than triple that of their male counterparts in the same age group (10.0 thousand).
In the 25–29 age group, there are a total of 75.0 thousand female migrants who follow their family or spouse to migrate to Beijing. Only 12.4 thousand male migrants of the same age have migrated to Beijing for the same reason.

Fig. 4.7
In-migration reasons given for Beijing’s female migrants in each age group in 2010 (Source: 6th Population Census 2010a)
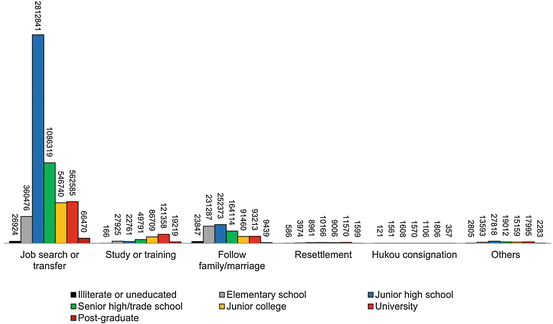
Figure 4.8 illustrates the distribution of education levels for each in-migration reason. Most of the job hunters have attained a junior high school education (2.8 million) or a senior high school education (1.1 million, see Fig. 4.8). Only 0.63 million migrant workers had a higher education or above. This explains why a mass of casual, dirty and low-paid jobs have been filled by the migrant workers in Beijing. A total of 0.69 million of the migrant population are poorly educated, having attained an elementary education or below, with some even being illiterate or uneducated. Half of these poorly-educated migrants have migrated to be part of Beijing’s labour market, whereas the other half have migrated mainly as a result of following their family or spouse or relatives to go to Beijing.
4.3.2 Origins of Beijing’s In-Migrants in 2010
In 2010, China’s total national population on the move amounted to 260.9 million, representing two types of in-migration: (a) intra-province/city in-migration; and (b) inter-province/city in-migration (see Table 4.8). Inter-province/city in-migration involves the unregistered permanent residents (migrant population) as previously mentioned.
Table 4.8
China’s population inflow (comprising intra-province/city in-migration and inter-province/city in-migration)
Provinces/cities | Intra-province/city in-migration | Inter-province/city in-migration | Total population inflow (million) | ||
|---|---|---|---|---|---|
Amount (million) | % | Amount (million) | % | ||
Total | 175.1 | 67.1 | 85.9 | 32.9 | 260.9 |
Beijing | 3.5 | 32.9 | 7.0 | 67.1 | 10.5 |
Tianjin | 2.0 | 39.6 | 3.0 | 60.4 | 5.0 |
Hebei | 6.9 | 83.1 | 1.4 | 16.9 | 8.3 |
Shanxi | 5.8 | 86.2 | 0.9 | 13.8 | 6.8 |
Inner Mongolia | 5.7 | 79.9 | 1.4 | 20.1 | 7.2 |
Liaoning | 7.5 | 80.8 | 1.8 | 19.2 | 9.3 |
Jilin | 4.0 | 89.8 | 0.5 | 10.2 | 4.5 |
Heilongjiang | 5.1 | 90.9 | 0.5 | 9.1 | 5.6 |
Shanghai | 3.7 | 29.2 | 9.0 | 70.8 | 12.7 |
Jiangsu | 10.9 | 59.5 | 7.4 | 40.5 | 18.2 |
Zhejiang | 8.1 | 40.6 | 11.8 | 59.4 | 19.9 |
Anhui | 6.4 | 89.9 | 0.7 | 10.1 | 7.1 |
Fujian | 6.8 | 61.0 | 4.3 | 39.0 | 11.1 |
Jiangxi | 4.7 | 88.7 | 0.6 | 11.3 | 5.3 |
Shandong | 11.6 | 84.6 | 2.1 | 15.4 | 13.7 |
Henan | 9.2 | 93.9 | 0.6 | 6.1 | 9.8 |
Hubei | 8.2 | 89.0 | 1.0 | 11.0 | 9.3 |
Hunan | 7.2 | 90.8 | 0.7 | 9.2 | 7.9 |
Guangdong | 15.3 | 41.6 | 21.5 | 58.4 | 36.8 |
Guangxi | 5.5 | 86.6 | 0.8 | 13.4 | 6.3 |
Hainan | 1.3 | 68.1 | 0.6 | 31.9 | 1.8 |
Chongqing | 4.5 | 82.6 | 1.0 | 17.4 | 5.4 |
Sichuan | 10.6 | 90.4 | 1.1 | 9.6 | 11.7 |
Guizhou | 3.9 | 83.5 | 0.8 | 16.5 | 4.6 |
Yunnan | 4.8 | 79.6 | 1.2 | 20.4 | 6.1 |
Tibet | 0.1 | 36.9 | 0.2 | 63.1 | 0.3 |
Shanxi | 4.9 | 83.5 | 1.0 | 16.5 | 5.9 |
Gansu | 2.7 | 86.1 | 0.4 | 13.9 | 3.1 |
Qinghai | 0.8 | 72.1 | 0.3 | 27.9 | 1.1 |
Ningxia | 1.2 | 76.0 | 0.4 | 24.0 | 1.5 |
Xinjiang | 2.5 | 58.1 | 1.8 | 41.9 | 4.3 |
According to the 5th and 6th Population Census, the total population in China on the move at the national scale reached 144.4 million and 260.9 million in 2000 and 2010 respectively. Out of these total national figures, the number of migrants who went through inter-province/city in-migration is reported to be 42.4 million and 85.9 million in 2000 and 2010 respectively. This demonstrates that the scale of population migration has been expanding in China.
Shanghai reportedly has the largest proportion of inter-province/city in-migration in the province/city’s total population on the move, at as high as 70.8 %, followed by Beijing (67.1 %), Xizang (63.1 %), Tianjin (60.4 %), Zhejiang (59.4 %) and Guangdong (58.4 %).
Table 4.9 shows the distribution of the national migrants and the origins of Beijing’s in-migrants. The relatively developed regions have reported a ratio of in-migrants to total permanent residents which is visibly higher than that of the under-developed regions. The ratio of in-migrants to total permanent residents is reported to be 39.0 % in Shanghai, 35.9 % in Beijing, 23.1 % in Tianjin, 21.7 % in Zhejiang, and 20.6 % in Guangdong.
Table 4.9
Distribution of national migrants and origin of Beijing’s migrants
