Demand and Supply of Maritime Transport Services: Analysis of Market Cycles
1.1.1 The Demand Side
The seaborne transport of commodities is regularly documented in statistical publications of leading brokers, NGOs or research institutes. Quite often though, these statistics are based on estimates as most publications reporting on international trade flows do not worry about the volume of goods transported as much as about their value. Therefore, the figures published on global seaborne transport volumes sometimes differ significantly from source to source and are adjusted several times. According to Stopford (2009), the development of the demand side is affected by:
(a)
The world economy, as a higher (or lower) economic output regularly requires a higher (or lower) input of resources and also generates more (or less) merchandise available for foreign trade. Hence, both the business cycle as well as the trade development cycle (nations going through a period of transition from a traditional society to a society of mass consumption and, hence, develop different consumption/production patterns of raw materials or merchandise) have a major impact on the demand for seaborne commodity transport.
(b)
Seaborne commodity trades, which may be subject to seasonal cycles in the short run (examples can be found in the crude oil, grain, or container trade) and which on may evolve in the long run, resulting from:
changing industrial demands
changing transport policies
depletion or discovery of resources
relocation of processing plants.
(c)
Average haul and ton miles, being the more precise measurement of the demand side than the pure information about the volume of shipped goods as the distance over which the commodities are transported can vary widely and often demand peaks (resulting in a higher volume) have to be satisfied using more distant suppliers (generating an even larger impact on the ton miles).
(d)
Random shocks like, wars, economic downturns, natural disasters, which can intensify the impact of seasonal or economic cycles or mess with the average haul…
(e)
Transport costs, as the general theory of maritime trade suggests that trade takes place if a commodity can be bought more cheaply in a different country, the ever declining cost of transport (resulting from the economies of scale) in itself has helped to boost maritime trade (Stopford 2009, pp. 140–149).
1.1.2 The Supply Side
The supply side of the markets is represented by the ships that carry the cargoes. The information about the historical development of the fleet is quite accurately documented in the leading fleet registers, for example, the Clarksons Register or the databases of IHS Fairplay. The future development of the fleet can in the short term be deviated from the orderbook of the yards and assumptions on likely scrapping activity although the financial crisis of 2008/2009 has shown that cancellation, slippage, or conversion of orders can play a major role in the short run. According to Stopford (2009), the supply side is affected by:
(a)
The world merchant fleet, contracting and expanding in cyclical movements of up to 20 years, and bringing about new ship types and designs eventually while phasing out older designs or vessel types.
(b)
The fleet productivity, which may vary depending on the use of the vessel. The effective transport capacity each vessel can provide during a given period of time is a function of the speed of the vessel, the time the vessel is caught up in the cargo handling procedures as well as the regular or non-regular maintenance. All these elements can change over time with investment in handling technology or changing demand patterns of the ship buyers. Additionally, the time spent ballasting or pursuing cargo contracts also limits the trading capacity of the vessel. A Clarkson study of the time use of VLCCs, for example, suggests that on average, VLCCs spend no more than 135 days per year on sea voyages with a cargo in the tanks. Lastly, the utilization of the vessels in terms of physical tonnage capacity used may also vary.
(c)
The shipbuilding production, being a cyclical industry, where a time span between the placement of the order and the actual delivery of the vessel can range up to 4 years.
(d)
Scrapping and losses, which are the counterpart to the shipbuilding production by reducing the fleet capacity. While age is the primary factor driving the demolition of the vessels, there are other factors like the market prospects, scrap prices, financial situation of the owners, etc. which play a role in the decision whether to scrap a vessel or not.
(e)
The freight revenue, being probably the most important element driving the supply side. In the long run, there seems to be an evident correlation between the earnings of a fleet segment and the amount of investment that is taking place in this particular market. In the short run, the supply-side reacts to higher freight revenues by speeding up the operation and thus delivering more trading capacity (Stopford 2009, pp. 151–160).
There are quite a few approaches to categorize shipping markets and it can be done by both loading categories, ship type designs, commodities, or even the way, the markets are organized (Biebig et al. 2008, p. 138).
From the viewpoint of a maritime economist aiming to analyze a shipping market, the most interesting perspective though would be to look at the competitive environment of a certain type of vessel. This analysis has become more complicated or easier in the second half of the past century – depending on one’s perspective.
Before the 1950s, the majority of seaborne trade would be transported on liner or tramp vessels of often equivalent sizes and designs and, hence, the tonnage could generally be switched between trades. The system worked well but was labor-intensive and because of the increasing labor costs, the shippers of industry raw materials sought to benefit more strongly from the economies of scale that the larger, more specialized vessels had to offer. Resulting from this as well as from the introduction of the container, the highly specialized shipping markets we are facing today have evolved. Those shipping markets offer individual vessel designs, charterers, and port equipment (Stopford 2009).
As these modern vessel types are basically no longer interchangeable like they used to be around the 1950s, analyzing the market of a certain type of vessel has become more easy because regularly only a few commodities need to be considered on the demand side (in case of very large oil or natural gas carriers as little as one commodity). Yet, as will be discussed in Sect. 1.1.3.5, some overlapping in the demand and supply of selected shipping markets appears to exist.
1.1.3 World Seaborne Trade and Merchant Fleet Development
Whilst some figures related to 2011 are still estimated and revisions of cargo handling statistics are a regular phenomenon in the runner-up year, it seems that the total amount of cargo trade has reached a volume of 9.1 bn tons and is headed for the 10 bn ton milestone in the near future.
As slightly more than 70 % of the entire seaborne trade (see Fig. 1.2) are raw materials or energy sources (see Table 1.1), it becomes clear why on average the seaborne trade has been growing in line with the output of the world economy over the last 20 years (see Fig. 1.3). Depending on the commodities, periodically special preconditions will lead to surprisingly high or low growth rates, as we will see in the following subchapters, which take a closer look at the major shipping markets and highlight the most important developments of the recent years.
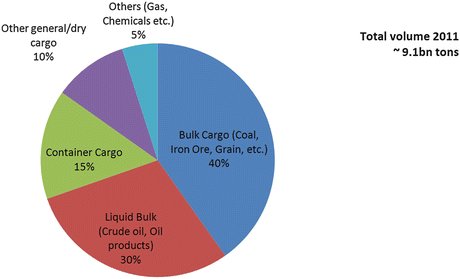
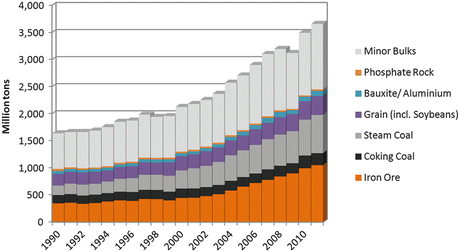

Fig. 1.2
Total seaborne trade by major loading categories. Source: ISL 2012 based on Clarksons Research

Fig. 1.3
Development of seaborne trade in dry bulk commodities 1990–2011. Source: ISL 2012 based on Clarksons Research 2011 = preliminary estimates
Table 1.1
Different approaches of categorizing shipping markets
Loading | Dry | Liquid | |||||
|---|---|---|---|---|---|---|---|
categories | bulk | bulk | General | ||||
Commodity | Major | Neo-bulk/ | Liquefied | Oil/oil | |||
group | bulks | minor-bulk | gas | products | Chemicals | Conventional | Container |
Commodity (selection) | Iron ore, coal, grain | Bauxit, phosphate rock, fertilizer, oilseeds, steel, timber, non-iron metals and ores, sugar, salt, cement, … | LPG (liquefied petroleum gas), LNG (liquefied natural gas) | Crude oil, petroleum, diesel, gasoline, koresene, … | Vegetable and animal oils and fats, organ. and anorgan. chemicals, foodstuffs | Sawn wood, cars, project cargo, rail cars, steel coils, cellulose, reefer cargo, … | Other manufactured and semi-manufactured goods, foodstuffs, consumer and investments goods, all theoretically containerisable goods |
Trading area | World-wide | … | Coastal shipping | ||||
Availability | Prompt tonnage | … | Forward contracts | ||||
Ship type | Bulker; tanker (gas, oil, oil products, chemicals, …); general cargo (container, multipurpose, heavy lift, …) | ||||||
1.1.3.1 Dry Bulk Shipping Markets
Stopford (2009) defines bulk commodities as cargoes which are carried in bulk carriers. Their common denominators are that they travel in large quantities and their physical attributes allow for easy (automated) handling. The alternative suggested definition is that they are commodities, which can be poured, tipped or pumped into the hold of a ship.
According to figures from Clarksons Research in the year 2011, roughly 3.6 bn tons have been transported on the dry bulk shipping markets. The volume comprises of the major bulks: iron ore, coal, and grain as well as bauxite/alumina and phosphate rock.1 These commodities travel in large parcels and account for two-thirds of the entire trade volume. The remaining third of the dry bulk trade is composed of a broad mixture of agricultural products, forest products, steel products as well as non-ferrous metal ores or scrap but also cement or fertilizers. These commodities typically are required in smaller quantities by the importing industries and typically show a higher value per ton.
Until the beginning of the new millennium, the demand-growth on the dry bulk shipping markets was fairly static and mostly reliant on the steam coal trade. This changed radically around 2002/2003, when China, already back then the largest producer of steel, massively increased its volume of iron ore imports at a pace that was underestimated by the largest parts of industry observes.
Between 2003 and 2008, the demand impact from the Chinese imports of iron ore has been the central topic around the development of freight and time charter rates. Although investment in new vessels accelerated around 2003 already, the Chinese hunger for raw materials kept exceeding the forecasts and when vessels were queuing up in congested ports (affecting the supply side by reducing the “fleet productivity”) and the Australian suppliers could not keep up with the Chinese demand growth and Brazilian suppliers stepped in happily (affecting the demand side by increasing the “average haul”), the markets have seen never before reached earnings as well as never before seen investments in new tonnage.
According to figures from IHS Fairplay, this unprecedented ordering boom has led to the dry bulk fleet surpassing the tanker fleet as the largest segment of the entire world merchant fleet, reaching a capacity of 602 M dwt early in 2012. The capacity growth of 17.1 % in 2010 and 14.8 % in 2011, respectively, has even surpassed the long term average capacity growth of the rapidly expanding container fleet, which grew by 11.5 % over the last 20 years (see Fig. 1.4).
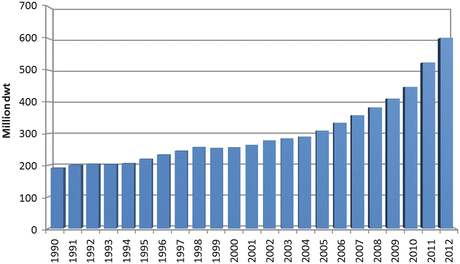

Fig. 1.4
Development of the Dry Bulk Fleet 1990–2012 (start of period). Source: ISL 2012 base on IHS Fairplay
Whilst having been notoriously undersupplied with tonnage during the years 2003–2007 and throughout most of 2008 (until the start of the global recession), the supply-demand-balance on the dry bulk shipping markets has developed in favor of the shippers in recent years, leaving shipping investors with relatively poor earrings and – resulting from the still filled orderbook early in 2012 only with medium-term hopes for a sustained recovery.
During periods of fundamentally oversupplied markets, it is not uncommon for freight rates to edge up sharply, as tonnage on the spot markets may be tight occasionally, resulting from unforeseen demand spikes (see Fig. 1.5). This has been observable, for example, late in 2011, when Chinese steel-mills stockpiled large amounts of iron ore, sending the Baltic Dry Index and especially capsize earnings to relatively high levels but having only a modest impact on the longer-term time charter earnings, which incorporate the future expectations of the market participants – the latter ones being quite bearish recently.
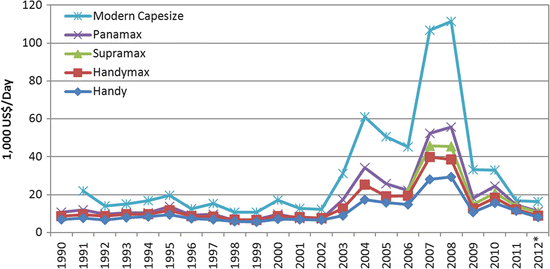

Fig. 1.5
Development of 1 year time charter rates for different bulk carriers 1990–2012 (period averages). (Asterisk) January until begin of March. Source: ISL 2012 based on Clarksons Research Shipping Review and Outlook 2012 (Clarksons Research 2012)
Although the longer lasting 1 year time-charter rates regularly smoothen out the volatility of the spot-market, time charter rates are quite volatile too. In the case of bulk shipping time charter-rates though, the volatility of the nineties is dwarfed by the scaling required by the 2007 and 2008 spike in earnings.
1.1.3.2 Liquid Bulk: “The Tanker Markets”
When brokers or market reports discuss “the tanker markets”, they are typically just referring to two particular trades, one being crude oil, one being the oil products trade. Whilst it is true that chemicals and liquefied petroleum gasses or liquefied natural gas or even juices, wine, or beer may travel in vessels referred to as ‘tankers’, these latter vessels are operating in a different and segmented market with virtually zero overlap.2
After initially having been transported only as refined products, the crude oil transport soared in the 1950s, 1960s, and early in the 1970s. After the 1970s recession and oil price shock, the seaborne crude oil trade fell sharply but has recovered since then and stands—with some distance to the iron ore trade left—as the largest individual commodity being shipped in bulk. For the year 2011, Clarksons Research estimated the crude oil trade volume to be 1.84 bn tons. The estimate for the oil products trade at the same time was about 1 bn tons smaller and stood at 837 m tons (see Fig. 1.6).
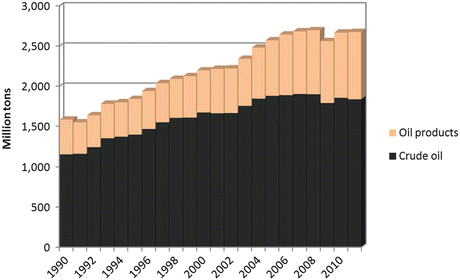

Fig. 1.6
Development of seaborne trade in oil and oil products 1990–2011. Source: ISL 2012 based on Clarksons Research 2011 = preliminary estimates
Early in 2012, the capacity of “the tanker fleet” has surpassed the “half-a-billion-milestone”, the relatively rapid expansion that becomes noticeable around the year 2004 is only partly attributable to the increased demand dynamics of the emerging Asian economies (see Fig. 1.7). Partly, the modern, double-hull tonnage had been ordered in advance of the phase out of the older single hull vessels, which was due in 2010.3
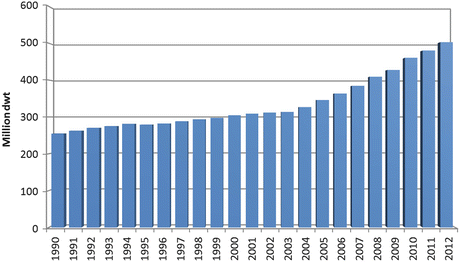

Fig. 1.7
Development of the tanker fleet (oil, oil products and chemical tankers) 1990–2012 (start of period). Source: ISL 2012 base on IHS Fairplay
Looking at the development of time charter markets for large crude oil tankers in the years 2008 and 2009 leaves the reader puzzling. Based on the fundamental dynamics (an economic downturn, colliding with an ongoing fleet expansion), a more massive downturn in earnings would have been expected. Yet, especially around the end of 2008, large crude carriers earned surprisingly strong rates on the spot markets (see Fig. 1.8).
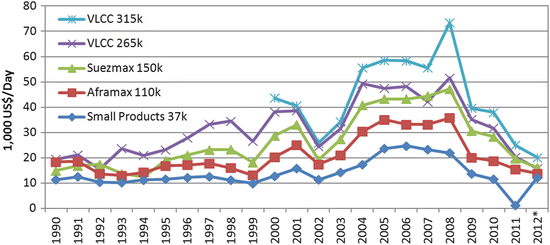

Fig. 1.8
Development of 1 year time charter rates for different tanker vessels 1990–2012 (period averages). (Asterisk) January until begin of March. Source: ISL 2012 based on Clarksons Research Shipping Review and Outlook 2012
Although the fleet expansion later on was clearly driven by the positive earnings situation, earnings during the boom years were not as strong as in the dry bulk sector. Hence, the advance ordering has certainly contributed to smoothen the market peak of the tanker markets. As a result, compared to the dry bulker markets, the tanker markets are equipped with a slightly more optimistic outlook for the medium term early in 2012—albeit from low levels.
The often made reference to the shipping markets being “perfect” markets, however, is related to the perfect competitive behavior of the tanker shipping industry (Glen et al. 2006, p. 270). This degree of competitiveness cannot be found in every shipping market though.
1.1.3.3 Container Shipping Markets
The clockwork-like double digit growth of the container shipping markets was fuelled by the globalization of trade flows as well as the containerization of the already existing general cargo flows (see Fig. 1.9). Whilst most industry observers expect both these demand drivers to lose momentum eventually, they still expect the container traffic to grow super proportionally in relation to the global GDP. Whilst historically, there have been only few opportunities to “mis-invest” in an industry with a regularly reappearing demand growth, the sharp economic downturn of 2008/2009 has set back the long term growth path of the demand side by approximately 3 years.
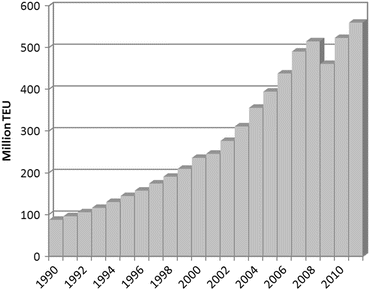

Fig. 1.9
Development of world container handling 1990–2011. Source: ISL 2012