The Technological and Economic Features of Brazilian Oil, Gas and Biofuel Industries

Fig. 1.1
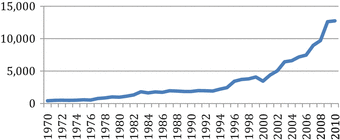
Brazilian crude oil balance (in millions of m3/year). Source: EPE (2013)
After the discovery of the region known as “Pre-salt” in 2007, the Brazilian government announced a revision of the 1997 model, maintaining it in principle but not adopting it as the only standard for exploration and production in this area. The role of the State in the oil and gas industries was reexamined, reinforcing its strategic importance for the development of the country.12
This culminated in Federal Law No. 12.351, published on December 22, 2010, which, among other issues, deals with production sharing contracts in Pre-salt and other strategic areas. It also created a Social Fund that will receive 50 % of Pre-salt revenues to support state-run socioeconomic programs. This is discussed in more detail in item 2 of the present chapter.
1.1.2 Current Market
As a result of the series of bidding rounds promoted by the ANP for oil exploration on September 2013, 312 concessions, operated by 25 companies, were awarded, raising national production to 2,094 Mbbl/day (1,000 barrels per day) of oil.
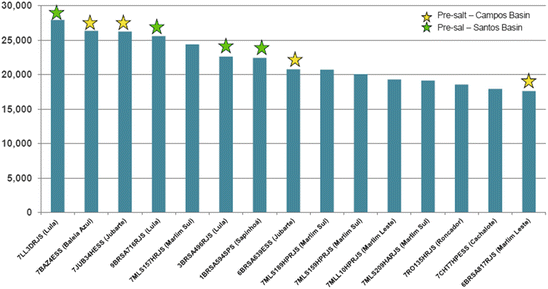
One peculiarity of Brazilian production is the predominance of oil production in maritime fields (91.7 % of total production), even though only 25.3 % of concessions were for offshore fields. This apparent contradiction is a consequence of the substantial production potential of offshore wells, especially those located in the presalt region. Figure 1.2 shows the country’s 20 largest oil producing wells on June 2013 (in barrels per day), the largest of which are offshore, with eight belonging to presalt reservoirs. It is important to underscore that according to ANP data, published on December 2012, Brazil has proven oil reserves of around 14,524.23 million barrels, 93.7 % of which are stored in offshore reservoirs.
The vast majority of onshore basins are considered to be “mature basins,” and in the various bidding rounds, Petrobras has demonstrated increasingly less interest in operating them, primarily due to their low production potential compared to their offshore counterparts, even though some exhibit promising natural gas production potential.
On September 2013, oil production in the mature onshore basins (located in the states of Espirito Santo, Rio Grande do Norte, Bahia, Sergipe and Alagoas) totaled 145.1 thousand bbl/day of oil, representing 6.7 % of national oil production. However, the results of onshore well production have remained constant in the last decade, thanks to stimulation techniques in the mature basins. The so-called marginal accumulations produce only around 92.0 bbl/day of oil.
In the Brazilian oil and gas production market, Petrobras is the largest producer, accounting for approximately 92 % of national oil production. Table 1.1 shows the oil and gas companies operating in Brazil in 2013 and their respective participation in national production.
Table 1.1
National oil and gas production by concessionaire
N | Company | Oil (bbl/day) | Natural gas (Mm3/day) | Oil (%) | Gas (%) |
|---|---|---|---|---|---|
1 | Petrobras | 1,932,559 | 72,690 | 92.29 | 93.02 |
2 | Statoil Brasil | 87,082 | 106 | 4.16 | 0.14 |
3 | Shell Brasil | 40,870 | 584 | 1.95 | 0.75 |
4 | OGX | 144 | 4,495 | 0.01 | 5.75 |
5 | Chevron Frade | 17,959 | 184 | 0.86 | 0.24 |
6 | BP Energy | 11,427 | 31 | 0.55 | 0.04 |
7 | Gran Tierra | 1,006 | 15 | 0.05 | 0.02 |
8 | Sonangol Starfish | 963 | 5 | 0.05 | 0.01 |
9 | Petrosynergy | 630 | 13 | 0.03 | 0.02 |
10 | Partex Brasil | 332 | 0 | 0.02 | 0.00 |
11 | Petrogral Brasil | 220 | 5 | 0.01 | 0.01 |
12 | Noa Petróleo Rec | 236 | 1 | 0.01 | 0.00 |
13 | UTC Óleo e Gás | 98 | 6 | 0.00 | 0.01 |
14 | Recôncovo E&P | 123 | 1 | 0.01 | 0.00 |
15 | UP Petróleo | 118 | 2 | 0.01 | 0.00 |
16 | Santana | 57 | 1 | 0.00 | 0.00 |
17 | Severo Villares | 25 | 1 | 0.00 | 0.00 |
18 | EPG | 23 | 1 | 0.00 | 0.00 |
19 | UTC Engenharia | 16 | 1 | 0.00 | 0.00 |
20 | Alvopetro | 18 | 0.2 | 0.00 | 0.00 |
21 | Central Resources | 18 | 0.02 | 0.00 | 0.00 |
22 | Cheim | 12 | 0.4 | 0.00 | 0.00 |
23 | Egesa | 6 | 0.01 | 0.00 | 0.00 |
24 | Genesis 2000 | 1 | 0.002 | 0.00 | 0.00 |
25 | Ral | 0.3 | 0.002 | 0.00 | 0.00 |
The basins with the largest oil production are located in the southeast of the country, in the states of Rio de Janeiro, São Paulo and Espirito Santo. The Campos Basin accounts for 78.60 % of national production, while the Santos Basin contributes with 10.61 %. Oil and gas production by State is presented in Table 1.2.
Table 1.2
National oil and gas production by State
State | Oil (bbl/day) | Natural gas (Mm3/day) | Oil (%) | Gas (%) |
|---|---|---|---|---|
Rio de Janeiro | 1,499,618 | 27,874 | 71.62 | 35.67 |
Espírito Santo | 315,762 | 12,031 | 15.08 | 15.40 |
São Paulo | 90,988 | 7,854 | 4.35 | 10.05 |
Bahia | 45,345 | 8,937 | 2.17 | 11.44 |
Amazonas | 28,236 | 10,665 | 1.35 | 13.65 |
Rio Grande do Norte | 59,499 | 1,500 | 2.84 | 1.92 |
Sergipe | 42,436 | 3,087 | 2.03 | 3.95 |
Maranhão | 144 | 4,495 | 0.01 | 5.75 |
Alagoas | 4,070 | 1,603 | 0.19 | 2.05 |
Ceará | 7,844 | 98 | 0.37 | 0.13 |
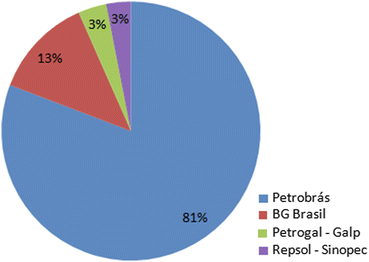
Presalt production on June 2013 reached an average of 376,216.53 boe/day (310,675.81 thousand barrels/day of oil and 10,396,068.7 m3/day of gas), which corresponds to 15 % of national oil production and 13 % of gas production. Production was obtained from only 27 wells with enormous production potential. The production of concessionaires in the presalt area is illustrated in Fig. 1.3, where the overwhelming predominance of Petrobras can be seen, with 81 %.
BG Brasil participated in partnership with Petrobras in the production of seven presalt wells, five in the Lula field (25 % share) and two in the Sapinhoá field (30 % share). Petrogral acted as a partner in the production of five wells, all in the Lula field (10 % share). Repsol was a partner in two presalt wells in the Sapinhoá field (25 % share). In addition to the current presalt production blocks, other fields are in the exploration stage with production expected by the end of 2013, as is the case of blocks operated by Petrobras based on an onerous transfer of rights agreement. It is underscored that commercial presalt production up to July 2013 originated in tendered fields in the concession regime. The first bidding round in the presalt production sharing regime occurred on October 21, 2013, with the offer of the Libra field in the Santos Basin.
The surplus of oil offered by the consortium, the criterion that defined the winning bid, was 41.65 %. Petrobras, which will operate Libra, entered with 10 % of the winning bid, in addition to its minimum participation of 30 % in the area. The other participants from the winning consortium were Shell (20 %), Total (20 %) and the Chinese companies CNPC (10 %) and CNOOC (10 %). Commercial production in the Libra field is expected to start in 2019.
Although Brazil has become self-sufficient in crude oil, a considerable amount of light crude is still imported, due to the characteristics of the oil produced in the Brazilian basins, which exhibits mean API of 24.5°. Only 10.0 % of production is considered to be light oil (≥31°API), 62.5 % is intermediate (≥22°API and <31°API) and 27.5 % is heavy (<22°API), according to the classification established by ANP Decree No. 09/2000. With this profile, it is economically feasible to import light crude to obtain a mixture to refine at lower costs in the production of high-grade derivatives (gasoline).
According to ANP data, the refining capacity installed in Brazil at the end of 2012 is approximately 2 million barrels/day. The largest refineries in the country are strategically located near the major production and consumption areas, as shown in Table 1.3, where the states of Rio de Janeiro and São Paulo account for 68.4 % of the country’s refining capacity.
Table 1.3
Refining potential in Brazil and volume processed
Refinery (state) | Capacity (bbl/day) | Total processeda (bbl/day) | National processed (bbl/day) | Imported processed (bbl/day) |
|---|---|---|---|---|
Riograndense (RS) | 17,014 | 16,058 | 15,606 | 452 |
Lubnor (CE) | 8,177 | 7,848 | 7,795 | – |
Manguinhos (RJ) | 13,838 | 10,439 | 22 | 9,038 |
Recap (SP) | 53,463 | 53,267 | 48,711 | 4,428 |
Reduc (RJ) | 242,158 | 227,299 | 129,521 | 91,899 |
Refap (RS) | 201,274 | 156,728 | 88,477 | 65,340 |
Regap (MG) | 150,956 | 147,098 | 142,992 | 312 |
Reman (AM) | 45,916 | 36,102 | 35,796 | – |
Repar (PR) | 207,564 | 199,390 | 142,757 | 56,280 |
Replan (SP) | 415,128 | 395,159 | 301,236 | 85,381 |
Revap (SP) | 251,593 | 243,782 | 220,874 | 22,718 |
RLAM (BA) | 279,897 | 237,976 | 230,195 | 2,652 |
RPBC (SP) | 169,825 | 156,754 | 136,786 | 18,837 |
RPCC (RN) | 37,739 | 36,458 | 36,458 | – |
Univen (SP) | 9,158 | 788 | – | 677 |
Dax Oil (BA) | 2,095 | 1,571 | 406 | 996 |
Total | 2,105,795 | 1,926,717 | 1,537,632 | 359,010 |
Table 1.3 shows that the volume of oil processed reached a limit of 91.5 % of refinery processing capacity. Considering oil production on September 2013, the country attained 99.4 % of processing capacity, but not all the oil produced in Brazil is processed in local refineries, due to commercial transactions of crude oil, ranging from light to heavy, in order to obtain the configuration desired for the national refining matrix. Brazil has invested in the construction of new oil refineries in order to expand refining infrastructure.
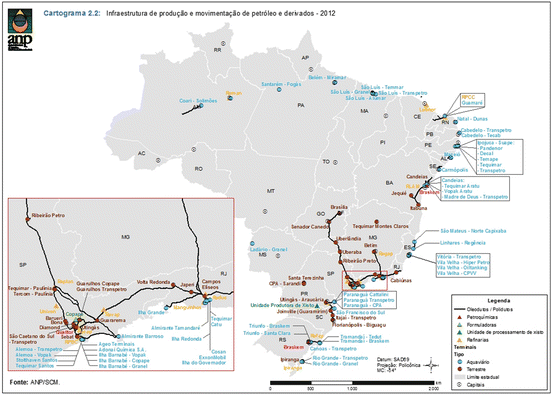
One of the bottlenecks in the current oil chain lies in the transportation infrastructure for crude oil. According to ANP’s annual report, at the end of 2012 there were only 32 oil transfer pipelines, with a total length of 1,985 km. The derivative transportation system is more favorable, where the country has 1,115 km of transfer pipelines and 98 transportation networks, totaling 4,794 km. Figure 1.4 illustrates the production infrastructure and oil and derivative transport at the end of 2012.


Fig. 1.4
Production infrastructure and oil and derivative transport—2012. Legend: oil pipeline/multipurpose pipeline, Petrochemicals, Formulators, Shale oil processing unit, Refineries, Terminals, Type, Water transportation, Land transportation, State limit, Capitals. Source: ANP (2012b)
1.1.3 Future Perspectives
The 10-year Energy Expansion Plan 2021 (PDE)13 was the first created after the passage of Federal Law No. 12.351/2010. It defined the presalt area as a portion of the Santos and Campos sedimentary basins formed by a vertical prism of indefinite depth with a polygonal surface delimited in the addendum of this Law.
Estimates of national oil and gas production between 2012 and 2021 encompass discovered resources, including those with declared commerciality (field reserves) or under exploratory assessment (contingent resources), as well as undiscovered resources, based on geological knowledge of Brazilian sedimentary basins, in both company-contracted and government-owned (noncontracted) areas.14
The process of creating oil and gas production projections for PDE 2021 initiated in the second semester of 2011, ending at the start of the fourth trimester of 2011. At the end of the first semester of 2012, production forecasts had to be revised in order to incorporate new and significant information contained in the 2012–2016 Petrobras Business Plan.15
Table 1.4 shows the potential daily national oil production forecast up to 2021. Sustained production only in total reserves (TR) relating to December 31, 2010, should drop slightly in 2013 and 2016, reaching the highest volumes between 2017 and 2018, declining thereafter.
Table 1.4
Forecast of annual national oil production classified by level of resource uncertainty
Period | Federal government | RND-E | CR | TR | Total |
|---|---|---|---|---|---|
2012 | 0.021 | 2.230 | 2.252 | ||
2013 | 0.033 | 2.213 | 2.246 | ||
2014 | 0.010 | 0.172 | 2.459 | 2.641 | |
2015 | 0.053 | 0.426 | 2.534 | 3.013 | |
2016 | 0.107 | 0.838 | 2.496 | 3.441 | |
2017 | 0.002 | 0.162 | 1.126 | 2.764 | 4.054 |
2018 | 0.088 | 0.202 | 1.643 | 2.782 | 4.715 |
2019 | 0.143 | 0.215 | 2.022 | 2.683 | 5.063 |
2020 | 0.236 | 0.235 | 2.147 | 2.686 | 5.305 |
2021 | 0.322 | 0.249 | 2.321 | 2.543 | 5.434 |
According to PDE 2021, in relation to the contribution of undiscovered contracted resources (RND-E), production is expected to begin in 2014, reaching nearly 5 % of total production in 2021. The possible contribution of resources in the federal area, depending on new concessions or product-sharing contracts projected for this PDE, is forecast to begin in 2017 and reach around 6 % of total potential production in 2021. With respect to the total, considering all sources of resources, it is estimated that production in 2021 has the potential of being 158 % higher than in 2011.16
Production originating in the so-called contingent resources (CR), sustained primarily by Geological Pre-Salt (GPS) accumulations, exhibits a growing tendency during the entire PDE period, accounting for around 43 % of production in 2021.17
According to PDE 2021, there will be significant oil surpluses, considering the national demand for this fuel, which will make Brazil an oil exporter and important player in the geopolitics of the oil and derivatives market.
In this respect, Table 1.5 shows the oil production forecast and estimated demand, based on the demand for derivatives discussed in Chapter VI of the PDE, and production surplus between 2012 and 2021.18
Table 1.5
Comparison between oil production forecast and estimated demand in Brazil
Period | Potential production | Estimated demand | Surplus |
|---|---|---|---|
2012 | 2.25 | 2.20 | 0.05 |
2013 | 2.25 | 2.24 | 0.01 |
2014 | 2.64 | 2.31 | 0.33 |
2015 | 3.01 | 2.38 | 0.63 |
2016 | 3.44 | 2.46 | 0.98 |
2017 | 4.05 | 2.54 | 1.52 |
2018 | 4.71 | 2.61 | 2.10 |
2019 | 5.06 | 2.72 | 2.34 |
2020 | 5.30 | 2.81 | 2.49 |
2021 | 5.43 | 2.89 | 2.54 |
With respect to the ratio between proven reserves and production (R/P), PDE 2021 assumes the following premises: first, the “evolution of oil and natural gas reserves is considered an essential component in energy planning in the country.”19
Second, this indicator helps determine the reserve depletion time. PDE 2021, in this regard, adopted a simplified model for proven reserves considering estimates of recoverable amounts, forecasts of time needed to declare commerciality, confirmation of possible discoveries, new areas for E&P contracts and the relations observed between total and proven reserves in Brazil, in the last 20 years. The results of applying the PDE 2021 model are found in Table 1.6. As we can see, the R/P is constant in the period analyzed.
Table 1.6
Evolution of proven national oil reserves and R/P
Period | Proven resources | R/P |
|---|---|---|
2012 | 15.62 | 19.01 |
2013 | 15.58 | 19.01 |
2014 | 18.32 | 19.01 |
2015 | 20.90 | 19.01 |
2016 | 23.86 | 19.01 |
2017 | 28.12 | 19.01 |
2018 | 32.70 | 19.01 |
2019 | 35.11 | 19.01 |
2020 | 36.79 | 19.01 |
2021 | 37.69 | 19.01 |
The PDE 2021 model presumes “the establishment of goals and restrictions compatible with historic levels of the R/P ratio and the relation between total and proven reserves in Brazil.”20
In this respect, the PDE 2021 compares this ratio in a number of locations worldwide as follows: the R/P for oil in 2010 was 14.8 years in the Asia-Pacific region, 14.8 years in North America, 21.7 years in Europe–Eurasia and 35.8 years in Africa.21
1.2 The Natural Gas Industry in Brazil
1.2.1 History
The following paragraphs focus on natural gas, primarily referencing the work of Moutinho dos Santos et al. (2002), “Natural Gas: strategies for new energy in Brazil.”
Geology in Brazil has always been very unfavorable for the development of natural gas. Thus, the Brazilian Industrial Revolution occurred with a growing dependence on oil and hydroelectricity.
The Brazilian situation is rather unique. Difficulties with domestic coal (inferior to imported coal), as well as restrictions on coal or naphtha imports, impeded the development of manufactured gas in the country. During the First World War, when the supply of coal on the international market became scarce, Brazilian gas companies began their decline.
Liquefied petroleum gas (LPG), which was introduced in Brazil in the 1930s and 1940s, also needed to be imported. Gradually, the role of this energy source declined, being confined to the limited function of “kitchen gas,” that is, primarily for domestic cooking, and receiving numerous government subsidies.
Nor did natural gas prove to be an attractive fuel. The Brazilian production of natural gas was limited, and when Petrobras expanded its offshore exploration and production activities, absolute priority was given to increasing oil production. The costs of developing gas in offshore fields inhibited the gas supply, while there was a large rise in flare gas. The alternative of importing natural gas from Argentina or Bolivia was definitively discarded during the 1970s and 1980s. The politicization of the energy issue precluded this option in a country under a military dictatorship that took into account precepts such as national security, self-sufficiency and nationalism.
Brazil once again awoke to the natural gas potential in the late 1980s and early 1990s, when gas, always seen as “Energy of the First World,” came to symbolize the modernity of a civilized country. Pressure from the upper classes of Brazilian society encouraged the development of the gas industry.
Petrobras became aware of a growing social resistance to the practice of flaring large amounts of gas at the wellhead. At the same time, the company itself started to develop a new approach to gas, recognizing the value of gas production and bringing it to the emerging Brazilian market. Monetizing gas reserves became one of Petrobras’ strategies for transforming itself into an energy company rather than purely an oil company.
The decline in nationalist movements, associated to the abandonment of the energy self-sufficiency concept, allowed the development of the regional energy integration concept. Restrictions to supply gas to the Brazilian market were reduced, with imports from Argentina, Bolivia and Peru. The country began to develop a new perspective for the energy security problem. In this new vision, complementary integration with its neighbors was undertaken with mutual benefit for both buyers and sellers.

