Prevalence and Correlates of Forced Sex Perpetration and Victimization in Botswana and Swaziland
Prevalence and Correlates of Forced Sex Perpetration and Victimization in Botswana and Swaziland
Male-perpetrated sexual violence against women is recognized as an important human rights concern worldwide.1 Not only is sexual violence a serious violation of women’s human rights, but it is also associated with many adverse health and psychological sequelae,2, 3 including HIV.4, 5 This creates a social context for gender-based power differentials that further limit women’s ability to refuse sex or negotiate safe sex practices. Policy and programming discussions about sexual violence prevention should therefore consider the gendered contexts in which sexual violence occurs.6–10
The United Nations’ Millennium Development Goals explicitly recognize achievement of gender equality as a critical foundation for human development. Gender-based violence is a key manifestation of gender inequality. Thus, identifying its risk factors is critical for devising appropriate preventive strategies. The Sexual Violence Research Initiative and the World Health Organization have also highlighted this as a key area for research.11–13 Some research in this area has focused on identifying risk factors for sexual violence victimization among women in South Africa,8, 14, 15 Uganda,16 and India.4, 5 A smaller body of work has focused specifically on correlates of sexual violence perpetration among men in South Africa17–21 and India.4
Despite the high priority of research in this area, correlates of gender-based violence have been little studied in Botswana and Swaziland. The prevalence and correlates of sexual violence vary across countries and regions1, 7, 22 with different gender-focused policies and legislation, suggesting that effective prevention strategies will be context specific.23 The context of gender inequality in Botswana and Swaziland is well documented,24 and these countries also have among the highest HIV prevalence rates in sub-Saharan Africa.25
Therefore, our goal in this study was to identify correlates of forced sex victimization among women and forced sex perpetration among men using population-based survey data from Botswana and Swaziland.
Methods
We conducted a population-based cross-sectional study between November 2004 and May 2005 among adults randomly selected from households in the 5 districts of Botswana with the highest number of HIV-infected individuals (representing a population of 725,000 in the eastern corridor of the country, out of a total population of 1.7 million)26 and in all 4 regions of Swaziland. We used a stratified 2-stage probability sample design to select the population-based sample of households.
Within each household, one adult member who had a primary residence there and who met the study’s inclusion criteria was randomly selected. Up to 2 repeat attempts were made to interview that person if the initial visit was unsuccessful. No replacements were made if participants could not be reached after the repeat attempts. We did not interview more than one member of the household. To be eligible for the study, individuals were required to be 18 to 49 years of age, to have no cognitive disabilities, to be residents of the country where the interview took place, and to be fluent in English, Setswana, or SiSwati. All interviewers were country nationals.
The survey instruments for both countries inquired about multiple domains, including sexual violence, sociodemo-graphic characteristics, health and mental health, and HIV risk behaviors. All surveys and consent forms were translated into Setswana or SiSwati and then back-translated into English to ensure that translations were accurate. All interviews were conducted in private settings, and anonymity was assured. Any study participant who appeared to be in emotional distress after answering sensitive questions was offered the opportunity to speak to one of the study health care providers and was referred to a local health care center for counseling.
The field research team consisted of country nationals who were trained by a team of Physicians for Human Rights research staff along with local field researchers. The supervisory team had extensive expertise in applied research, human rights, gender issues, mental health, and HIV/AIDS. All local field researchers had prior survey experience, and many had expertise in HIV/AIDS work. The training included detailed instruction in the study protocols and research ethics and consisted of classroom teaching and role play followed by field practice in interviewing. Continuous field supervision was provided throughout the study. The survey team received specific training on how to enumerate households (e.g., not counting nonresidential buildings, counting each separate household on the same property separately) and how to ask sensitive questions in an appropriate, nonjudgmental manner. Full details of the survey implementation have been published elsewhere.24
Outcome Measures
Among women, we gathered information on 12-month history of forced sex with the question “Were you forced to have sex against your will over the past 12 months?”11, 22 Information on lifetime history of victimization among men and women was obtained with the question “In your lifetime, have you ever been forced to have sex when you did not want to?” Among men, the question “Did you have sex with others when they did not want to over the past 12 months?” was used to gather data on perpetration of forced sex in the preceding year.19, 20 In the Swaziland survey, men were also asked a question about lifetime forced sex perpetration: “In your lifetime, have you ever had sex with someone when they did not want to?” Of note, this survey was implemented as a study of gender equity in general and therefore did not make use of multiple questions to inquire about different aspects of sexual violence.
Prior research has described how the social context in which sex occurs itself shapes women’s risk for sexual violence, and sexual violence takes many forms (in addition to the act of forced sex).8, 11 Therefore, in supplementary analyses focusing on women we also examined correlates of lack of control in sexual decision making, which was defined according to a Likert scale-based measure in which women described the extent to which their partners made decisions about when to have sex. Women were categorized as lacking control in sexual decision making if they stated that their partners “usually” or “always” made the decisions about when to have sex.
Key Covariates
Our decisions about which risk factors to investigate were guided by an integrated ecological framework that has been proposed for conceptualizing the etiology of gender- based violence27 as well as consideration of previously identified risk factors from other developing country settings.6, 8, 10, 15, 17–20 Sociodemographic variables included age, marital status (married, living with partner, other), educational level (high school vs less than high school), monthly household income (more than vs less than 5,000 pula or emalangeni; approximately 800–801,000 U.S. dollars), and area of residence (urban vs rural). On the basis of prior research linking food insufficiency to risky sexual behaviors among women,28 we included food insufficiency as a potential risk factor. The food insufficiency survey question was adapted from an analysis of data from the Third National Health and Nutrition Examination Survey,29 in which food insufficiency was defined according to a Likert scale based measure in which participants reported whether they “sometimes” or “often” had not had enough food to eat over the previous 12 months.
We defined problem drinking as consumption of 8 to 14 drinks per week for women and 15 to 21 drinks per week for men, and we defined heavy drinking as consumption of more than 14 drinks per week for women and more than 21 drinks per week for men.30 We assessed self-reported health status on a Likert scale in which the categories were fair, poor, and other.
We also included 3 variables related to risky sexual behaviors over the preceding 12 months: having had multiple partners (vs 1 or none), having had transactional sex, and having had an intergenerational sexual relationship. The latter 2 variables were defined differently for men and women. Women were asked whether they had exchanged sex for money, food, or other resources and whether they had been involved in a sexual relationship with someone 10 or more years older. Men were asked whether they had paid for or provided resources in exchange for sex and whether they had been involved in a sexual relationship with someone 10 or more years younger. Finally, we also included lifetime history of forced sex victimization. We did not have further data on the sex of the perpetrator.
Statistical Analysis
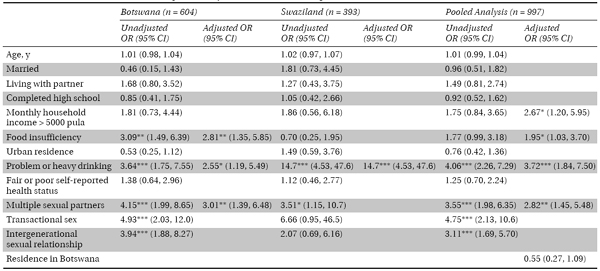
We used Stata version 11 (StataCorp LP, College Station, Texas) in conducting our statistical analyses. Using univariable logistic regression, we calculated unadjusted odds ratios (ORs) to estimate the degree of association between each of the risk factors and outcomes assessed. We fit separate models by country to identify potential country-level differences, and we also fit pooled models with a binary indicator variable equal to 1 for residence in Botswana. Risk factors significant at P < .25 in univariable analyses were identified as candidates for multivariable logistic regression analyses,31 and the final models retained only variables significant at P < .05.
Because of small cell sizes caused by the rarity of the outcome variables, we encountered the problem of separation, that is, covariates perfectly predicting the outcome of interest and therefore yielding infinitely large or infinitely small parameter estimates. To eliminate this small-sample bias, we employed the penalized-likelihood correction proposed by Firth32–35 when fitting the logistic regression models.
In Botswana, 1433 individuals were randomly selected and approached to take part in the study. Of these individuals, 46 (3.2%) could not be located after 2 repeat visits, 78 (5.4%) refused to take part or did not meet the study criteria, and 41 (2.9%) were unable to complete the survey. We obtained completed surveys from 613 men and 654 women in Botswana (89% response rate). In Swaziland, 876 men and women were randomly selected and approached to take part in the study. Of these individuals, 35 (4.0%) could not be located after 2 repeat visits, 32 (3.7%) refused to take part or did not meet the criteria, and 3 (0.3%) were unable to complete the survey. We obtained completed surveys from 398 men and 407 women in Swaziland (92% response rate).
Among women, 12-month prevalence rates of forced sex victimization were 4.6% in Botswana and 4.7% in Swaziland (Table 20.1). Lifetime prevalence of forced sex victimization was 10.3% in Botswana and 11.4% in Swaziland. Among men, lifetime prevalence rates of forced sex victimization were 3.9% in Botswana and 5.0% in Swaziland. The 12-month prevalence of forced sex perpetration among men was 4.2% in Botswana and 1.8% in Swaziland. In Swaziland, the lifetime prevalence of forced sex perpetration among men was 7.4%. Other characteristics of the sample are provided in Table 20.2.
Table 20.1 Past-Year and Lifetime Prevalence of Forced Sex Perpetration by Men and Forced Sex Victimization of Men and Women in Botswana and Swaziland, 2004–2005
Botswana, No. (%; 95% CI) | Swaziland, No. (%; 95% CI) | |
Forced sex perpetration | ||
Past 12 months | 26 (4.3; 2.7, 5.9) | 7 (1.8; 0.5, 3.1) |
Lifetime | … a | 29 (7.4; 4.8, 10.0) |
Forced sex victimization | ||
Past 12 months: women | 30 (4.6; 3.0, 6.2) | 19 (4.7; 2.6, 6.8) |
Lifetime: women | 67 (10.3; 7.9, 12.6) | 46 (11.4; 8.3, 14.5) |
Lifetime: men | 24 (3.9; 2.4, 5.5) | 20 (5.0; 2.9, 7.2) |
Note. CI = confidence interval.
a Question was not asked of male participants in the Botswana survey.
Table 20.2 Characteristics of Male and Female Study Participants: Botswana and Swaziland, 2004–2005