Child Poverty in the International Context

Fig. 2.1
Child relative poverty across selected countries (UNICEF Innocenti Report Card 10)
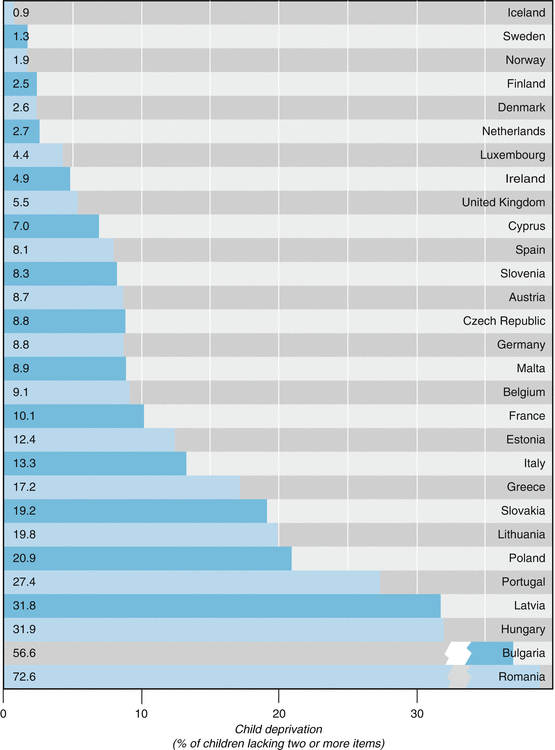
Deprivation2 amongst children varies across countries from as little as 1 % in Iceland and many as 57 % of children in Bulgaria and 72 % in Romania (Fig. 2.2, UNICEF Innocenti Report Card 10). In Northern European countries and the Netherlands the percentage of deprived children is under 3 %, and 5.5 % of children in the UK and 13.3 % of children in Italy are categorised deprived (Fig. 2.2).


Fig. 2.2
Child deprivation in 29 economically advanced countries (UNICEF Innocenti Report Card 10)
The recent mortgage crisis has forced children out of their homes and schools; it was estimated that 1.95 million children were impacted by the mortgage crisis in the US alone (Lovell and Isaacs 2008). Although the financial crisis has not affected Australians much, the most recent Salvation Army report (2013) in Australia found that 99 % of people accessing income support did not have $500 in savings, 98 % did not have a decent stable home and 51 % came from households with children. It was highlighted that children living in poverty are missing out on out of school activities (53 %), activities (37 %), new uniforms or to date school books (39 %) and annual dental check-ups (39 %).
Over a decade ago the lack of a consistent estimate of the extent or severity of child poverty in developing countries has been noted. At that time UNICEF has estimated that approximately half of those living below the World Bank’s ‘poverty thresholds’ ($1–$2 per day) are likely to be children. Furthermore, between 1987 and 2000 the number of people living on less than $1 a day in developing countries other than East Asia and the Pacific has been increasing by 12 million a year (Gordon et al. 2000).
In 2010 Alkire and Santos presented the new Multidimensional Poverty Index (MPI)3 for 104 developing countries. Three dimensions of poverty, namely health, education and living standards, were considered through the MPI. These dimensions were selected as they are directly linked to the Millennium Development Goals (MDG). Using data collected from a number of sources available across countries, Alkire and Santos (2010) identified countries with highest levels of deprivation (high MPI) and the percent contribution of deprivation in education, health and living standard to poverty. Comparisons with the World Bank poverty thresholds of $1.25, $2 and the national poverty line are also provided. Within Europe and Commonwealth of Independent States (CSI), Tajikistan, Turkey and Estonia ranked highest in terms of multidimensional poverty. Haiti, Nicaragua and Bolivia are most deprived amongst Latin America and Caribbean while in East Asia and the Pacific Lao, Cambodia and Indonesia had highest MPI; for these countries income poverty was equally high. Amongst Arab states, Somalia, Yemen and Morocco were identified as poorest, and Nepal, India and Bangladesh (closely followed by Pakistan) in South Asia. A large number of Sub-Saharan African countries ranked 75 or higher (out of 104) in terms of multiple deprivation, with Niger, Ethiopia, Mali, Burkina Faso and Burundi ranking the highest. While in some countries health and living standards are the main contributors to multiple-deprivation (e.g., countries like Hungary, Latvia, Czech Republic, Guyana, Indonesia, Gabon, Zambia, Chad) in other counties education brings highest contribution to deprivation (e.g., countries like Uruguay, United Arab Emirates, Russian Federation, Guatemala, China, Brazil, Estonia, South Africa, or Ecuador). For a complete list of countries and their level of deprivation and poverty see Alkire and Santos (2010).
2.3 Child Poverty: Definition and Measures
2.3.1 Definitions of Child Poverty
Absolute or relative monetary thresholds have been long used by governments and policy makers to define poverty. Absolute poverty is identified where income is insufficient to provide basic needs such as food or shelter. Individuals, families or groups experience relative poverty ‘if they lack the resources to obtain types of diet, participate in the activities and have the living conditions and amenities which are customary, or at least widely encouraged or approved in the societies in which they belong’ (Townsend 1979, pp. 31). Complementing such material measures to define poverty, the past decade has seen the development of more comprehensive approaches to define, identify and measure poverty. Efforts have come from international organisations and scholars equally.
The UNICEF identifies children living in poverty as those who ‘experience deprivation of the material, spiritual and emotional resources needed to survive, develop and thrive, leaving them unable to enjoy their rights, achieve their full potential or participate as full and equal members of the society’ (UNICEF 2005).
The Christian Children’s Fund (CCF) defines child poverty through deprivation, exclusion and vulnerability. The CCF argues that poor children lack material conditions essential to the development of children’s full potential (deprivation), their rights are denied, their existence threatened (exclusion), and they often live in threatening environments (vulnerability).
Although the United Nations Development Program (UNDP) does not provide an exact definition for child poverty the organisation advocates a holistic approach through principles of basic needs and human rights: ‘the right to a standard of living adequate for the child’s physical, mental, spiritual, moral and social development (UNDP 2004:12), ‘food security, shelter, and water and sanitation, all of which are essential to enhancing children’s well-being (p. 4).
The first ever internationally agreed definition of child poverty was formulated by the United Nations General Assembly (UNGA) in 2006. As described in the opening paragraph of this paper, the UNGA pinpointed a number of needs – water and sanitation facilities, access to basic health-care services, shelter, education, participation and protection – for children to develop and reach their full potential and to participate as full members of society.
Researchers and scholars have taken important steps in defining poverty through approaches that go beyond financial deprivation. Saunders et al. (2007) define deprivation (not poverty) as the lack of resources that prevent people from accessing essential goods and activities and identify severe deprivation as missing out on five or more essential items.4 The Childhood Poverty Research and Policy Centre (CHIP) adopted a holistic definition of poverty: children and young people growing up without access to different types of economic, social, cultural, physical, environmental and political resources that are vital for their wellbeing and for them to fulfil their potential.
Some scholars and organisations have migrated towards identifying not only the income poor, but those experiencing social exclusion due to income poverty. Addressing social exclusion and not income poverty alone is important from a policy perspective because aspects such as ethnic, gender or racial dimensions, which go beyond income poverty, must be addressed (Hunt 2004). In the mid-1980s the European Economic Community adopted an expanded definition of poverty: ‘the poor’ shall be taken to mean persons, families and groups of persons whose resources (material, cultural and social) are so limited as to exclude them from the minimum acceptable way of life in the Member states in which they live’ (Article 1.2 in Huston (2011)). A couple of decades later, Kahn and Kamerman (2002) defined social exclusion due to poverty as inequalities in ‘basic living; family economic participation; housing; health; education; public space; social participation; as well as subjective experience of social exclusion’ (p. 27).
Difficulties or discrepancies in definitions of child poverty often result from ‘child’ and ‘poverty’ being two contested concepts. For example, Main (2014b) explains that ‘child’ can be understood as a person under the age of 18 (according to the UNCRC definition), or under the policy definition: a person under 16 or 16–19 year old person who is not married, living with parents and in non-advanced full-time education. Furthermore, ‘poverty’ can be understood as income poverty, material deprivation, social exclusion or wellbeing. It is then recommended that research into child poverty should account for the multidimensional nature of poverty, include children’s own experiences and perceptions (such as in the Young Lives study), develop measures of child material deprivation based on children’s own conceptions of their material needs and draw on consensual poverty measurement methods (Main 2014b).
2.3.2 Measures of Child Poverty
Poverty is a social fact and researchers, governments and international organisations equally admit the necessity to measure poverty, to answer the question ‘Who is poor?’ in order to reach those at risk of living deprived. The debate around measures of poverty is as wide if not wider than that around the definition of poverty. Efforts to measure child poverty have included:
How can governments and donors claim to be targeting progress when they don’t even know where they’re starting from? Indeed, how can the well-being of children be improved, if those children are – literally – not counted? (Save the Children 2012)
Measures of absolute and relative deprivation (e.g., poverty line, child poverty gap)
Measures of national levels of child poverty through poverty indicators such as malnutrition and infant and child mortality (UNICEF)
Composite measures of poverty (e.g., Child Development Index, Child Well-being Index, Australia Early Development Index) drawing on the Capabilities Approach (Sen 1999)
Subjective child well-being (Bradshaw 2010)
2.3.2.1 Absolute and Relative Child Poverty
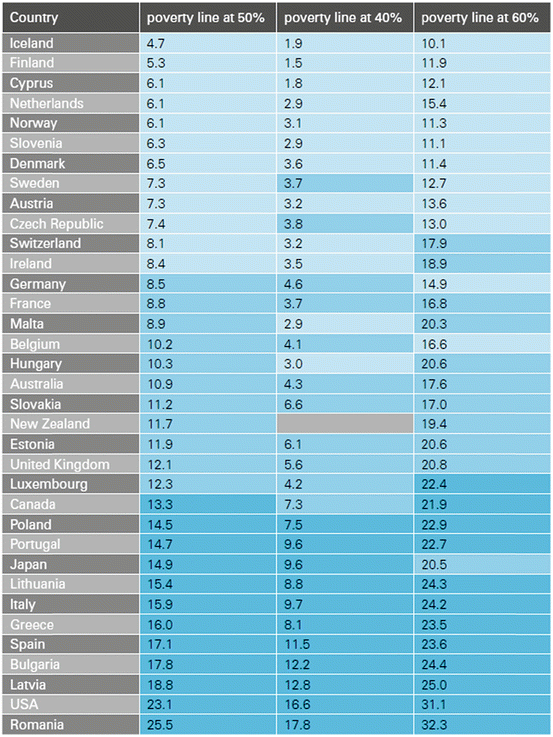
For decades income poverty was the main if not sole method to monitor and measure child poverty. Originating in 1963 from estimates of the minimum food budget required for adequate nutrition, the poverty line or threshold was an estimate of the minimum income needed by an individual or family to avoid serious material hardship (Huston 2011). Most often the poverty line is set at 50 or 60 % of the median household disposable income. As such, the number of individuals identified as poor differs widely depending on the poverty line or level used (Table 2.1). When the poverty line is defined at 60 % the proportion of children living in poverty more than doubles in countries like Iceland, Finland, Cyprus and the Netherlands than when the poverty line is set at 50 % (Table 2.1). At the 60 % threshold 17.6 % of children in Australia,5 20.8 % in UK, 24.2 % in Italy and 31.1 % in USA live in relative poverty.

Table 2.1
Child poverty rate at 40, 50 and 60 % poverty line in selected countries (UNICEF Innocenti Report Card 10)

While the poverty rate counts the number of individuals below the poverty line, the poverty gap measures the mean shortfall from the poverty line, expressed as a percentage of the poverty line, i.e., how much below the poverty line the average poor is located. There does not seem to be a linear relationship between child poverty rate and child poverty gap (Table 2.2). Across OECD countries the child poverty rate (measured at 50 %) varies from 3.6 % in Finland to 23.6 % in Romania with 15 countries showing a child poverty rate lower than 10 % while 4 countries (Latvia, Romania, Bulgaria and the US) show a child poverty rate higher than 20 % (Martorano et al. 2013). The child poverty gap ranges between 10 and 40 %, with Cyprus at 11 % and Spain at 39 % (Table 2.2).
Table 2.2
Child poverty rate and child poverty gap across selected OECD countries
Selected countries | Child poverty rate (poverty line at 50 %) | Child poverty gap |
|---|---|---|
Finland | 3.6 | 17.0 |
Netherlands | 5.9 | 15.7 |
Cyprus | 6.5 | 11 |
France | 9.5 | 18.2 |
Germany | 9.4 | 19.4 |
UK | 10.0 | 23.0 |
Denmark | 6.3 | 29.0 |
US | 23.1 | 37.5 |
Australia | 10.9 | 13.6 |
Japan | 14.9 | 31.1 |
Italy | 17.0 | 31.0 |
Spain | 19.7 | 39.0 |
Latvia | 20.5 | 27.3 |
Lithuania | 17.9 | 35.6 |
Romania | 23.6 | 37.5 |
In Hong Kong measures of poverty are often concerned with the absolute monetary power people hold rather than inequalities. The Deprivation Index Score (DIS) identifies levels of deprivation by asking whether the person thinks a number of items are necessary, whether they own them, and if they don’t, whether that was because they could not afford them. Forty-two per cent of those identified as income poor (two lowest income deciles) in Hong Kong are also deprived.
There are various concerns with using income exclusively to identify the impoverished:
Data on incomes may not be reliable and most of the time this is measured before housing costs
When conducting international comparisons using income there is a failure to account for whether services such as health care, child care and education are subsidised
Income measures do not reflect the fact that some families are more competent than others in managing income or prioritising spending (e.g., parents sacrificing such that children can enjoy same opportunities as their peers)
By different definitions, the number of poor varies dramatically (e.g., Table 2.1)
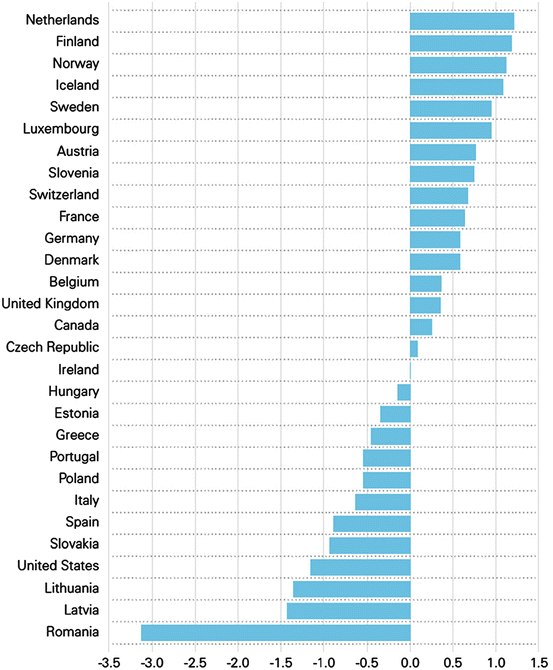
Some studies have combined monetary and material deprivation to identify the level of material child poverty. As discussed, monetary deprivation refers to household income levels below the 50 or 60 % median income line, while material deprivation refers to the lack of ‘things’ considered necessary to live according to societal standards. The UNICEF counted as experiencing material deprivation those children who indicated they lacked at least 2 out of 14 items: three meals a day, at least one meal a day with meat, chicken or fish (or a vegetarian equivalent), fresh fruit and vegetables every day, books suitable for the child’s age and knowledge level, outdoor leisure equipment (bicycle, roller-skates, etc.), regular leisure activities (swimming, playing an instrument, etc.), indoor games (computer games, etc.), money to participate in school trips and events, a quiet place with enough room and light to do homework, an internet connection, some new clothes (i.e., not all second-hand), two pairs of properly fitting shoes, the opportunity, from time to time, to invite friends home to play and eat, the opportunity to celebrate special occasions, birthdays, etc. The Netherlands, Finland, Norway, Iceland are the best performing countries in terms of material child deprivation. Romania is by far the worst performer (amongst countries included in the UNICEF RC 11), followed by Lithuania, Latvia and the USA (Table 2.3).

Table 2.3
Child material deprivation, league of countries (UNICEF Innocenti Report Card 11)

2.3.2.2 Indicators of Child Poverty and Composite Measures of Well-Being
An increasing number of studies draw the attention to the risks flowing from the extensive use of income poverty measures as part of most indicators of child poverty (Bradshaw and Richardson 2008) and the necessity to use additional measures such as child deprivation or parental deprivation (Adelman et al. 2012) or multi-dimensional measures of child well-being (UNICEF Innocenti Research Centre 2007) to effectively monitor and measure child poverty. Arguing income poverty or material deprivation are not sufficient to define or measure poverty, Bradbury (2003) proposed alternative measures such as the index of child deprivation (per cent of children lacking specific items) or the family affluence scale (per cent of children reporting low family affluence) to account for material deprivation beyond income poverty.
Complementing efforts to measure child poverty through absolute and relative material deprivation, a range of methods and approaches to measure child poverty and well-being have been developed over the past decades: measures of national levels of child poverty through indicators such as child malnutrition, infant mortality or under five mortality (UNICEF), measures based on the Capabilities Approach (Sen 1999) such as the Human Poverty Index (UNDP 1997) and composite measures of poverty. Composite measures of poverty include:
Child Development Index (Save the Children 2008)
Bristol Deprivation approach (based on child rights to adequate nutrition, safe drinking water, decent sanitation facilities, health, shelter, education and information)
The Alkire-Foster method (2007, 2011) (argues the importance of going beyond reporting the ‘headcount’ and accounting for the intensity of each person’s poverty)
Child Well-being Index (UNICEF, RC7) (measures the average of wellbeing in a number of dimensions: material well-being, health and safety, education, behaviours and risks, and housing and environment)
EU Child Well-being Index (incorporates a summary of 23 domains)
US Child and Youth Well-being Index
Young Lives Approach (implemented in Ethiopia, Peru, India and Vietnam)
Australian Early Development Index (AEDI) (measures children’s development as they enter primary school in five areas: physical health and well-being, social competence, emotional maturity, language and cognitive skills, and communication skills and general knowledge)
Freedom Poverty Measure (Australia)
Multidimensional Poverty Index (UNDP 2010)
We discuss here three of these composite methods to measure child poverty: Child Development Index (CDI), the Bristol Deprivation approach and the Alkire-Foster method. The most recent levels of child well-being in OECD countries, measured through the Child Well-being Index are presented at the end of the section.
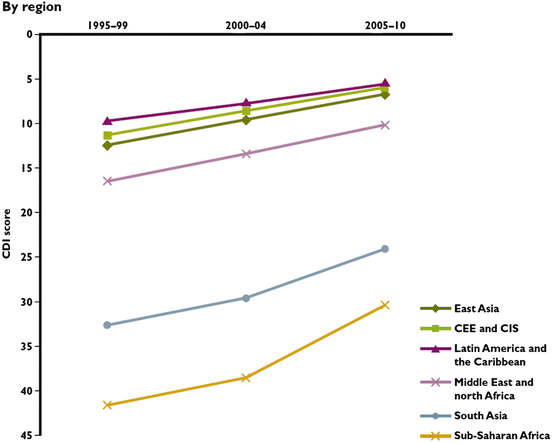
Child development index (CDI, Save the Children) is a composite measure of three elements of well-being: health, education and basic needs. Health is measured through the under-five mortality rate, education is measured through the percentage of primary-age children not in school, and basic needs are assessed through nutrition (under-weight prevalence among under-fives), as the most basic need. The score can oscillate between 0 and 100 and low scores indicate lower levels of deprivation. An extreme score of zero would indicate that all children survive beyond their fifth birthday, all under 5 year olds are well nourished and all primary school-aged children are enrolled in school. The average CDI score is 1.69 for developed countries and ten times greater – 16.86 – for developing countries. Although great progress has been achieved in reducing poverty between the first and the final half of the 2000s, there are large differences between developed and developing countries (Fig. 2.3 and Table 2.4).


Fig. 2.3
Child development index by region, performance over time, 1995–2010 (Save the Children 2012)
Sample size | Child development index 2005–2010 | |
|---|---|---|
Developed countries | 24 | 1.69 |
Developing countries | 117 | 16.86 |
By region: | ||
East Asia | 11 | 6.62 |
CEE and CIS | 15 | 5.84 |
Latin America and the Caribbean | 25 | 5.62 |
Middle East and north Africa | 14 | 10.11 |
Sub-Saharan Africa | 45 | 30.38 |
South Asia | 7 | 24.11 |
By income level: | ||
Low income | 50 | 26.31 |
Lower-middle income | 49 | 6.14 |
Upper-middle income | 18 | 5.01 |
High income | 24 | 1.69 |
World | 141 | 15.54 |
The Bristol method was developed by Gordon et al. (2003) to produce meaningful scientific comparisons of child poverty between developing regions of the world. The method was adopted by UNICEF as a core child poverty measure for the Global Study on Child Poverty and Disparities. Gordon et al. (2003) aimed to measure children’s living conditions that are so severely deprived that they are indicative of absolute poverty. Their method sets deprivation thresholds across a number of domains: shelter, sanitation, water, information, food, education, and health. The method identifies that a child is living in absolute poverty only if he or she suffers from two or more severe deprivations.